
Figures & data
Table 1 Descriptive statistics.
Table 2 Main results.
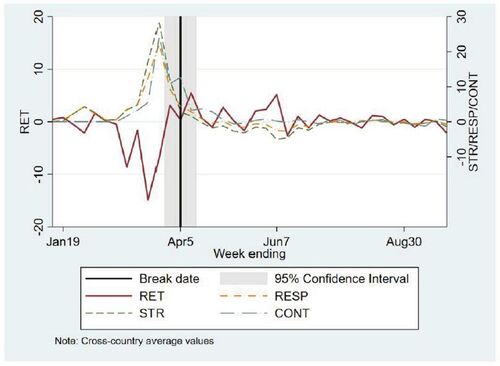
Fig. 1 Plotting the cross-sectional averages of RET, STR, CONT and RESP.
NOTE: The figure plots the weekly cross-sectional averages of stock returns (RET), government stringency (STR), government containment and health (CONT) and overall government response (RESP). The break date estimate and the associated 95% confidence interval are taken from . The reported dates refer to the last day of the relevant week.
Supplemental material