
Figures & data
Table 1 Test size.
Fig. 1 Power functions IU test low dimensions. The figure reports the conditional predictive ability test of Giacomini and White (Citation2006), GW, the multivariate GW test, MGW, the Diebold and Mariano (Citation1995) test, DM, the Mariano and Preve (Citation2012) test, MP, and the Fisher (Citation1934) test. The x-axis reports the absolute values of the boundaries imposed on the distribution of .
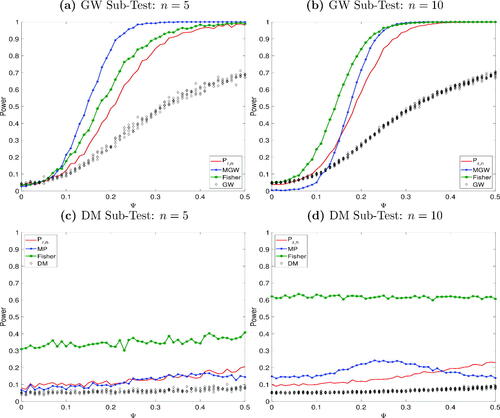
Fig. 2 Power functions IU test rejection accuracy. The figure reports the conditional predictive ability test of Giacomini and White (Citation2006), GW, the multivariate GW test, MGW, the Diebold and Mariano (Citation1995) test, DM, the Mariano and Preve (Citation2012) test, MP, and the Fisher (Citation1934) test. The x-axis reports the absolute number of the true null hypotheses.
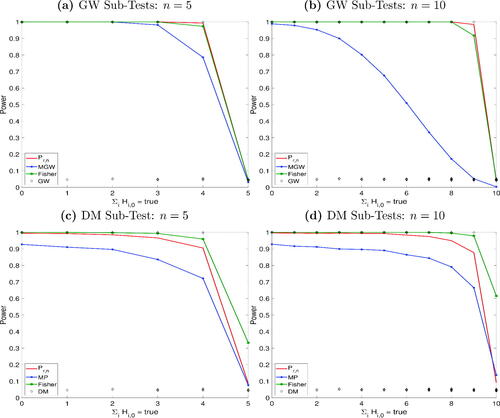
Fig. 3 Power functions IU test high dimensions. The figure reports the conditional predictive ability test of Giacomini and White (Citation2006), GW the Clark and West (Citation2007) test, CW, and the Fisher (Citation1934) test. The x-axis reports the mean of the first DGP.
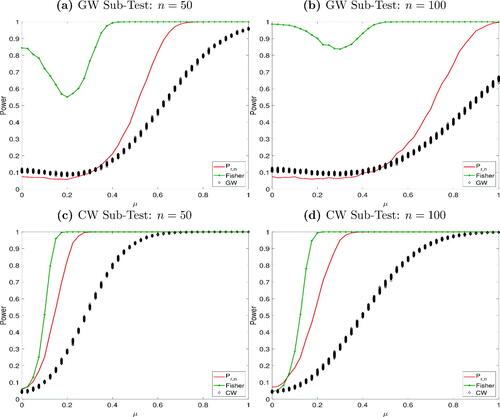
Table 2 Rejections for each individual test.
Table 3 Test statistic for combined p-values.