
Figures & data
Table 1 Comparison of break detection results.
Table 2 Detection results with breaks on weak factors.
Fig. 1 The detected break times in the covariance structure of the 375 daily returns of the S&P 500 constituents from January 01, 2000 to February 28, 2021. The estimated break dates for common components are April 24, 2000, November 25, 2002, September 12, 2008, May 08, 2009 and March 06, 2020 (in red lines); and the estimated break dates for idiosyncratic components are August 06, 2002, September 11, 2008 and May 11, 2009 (in blue dotted lines).
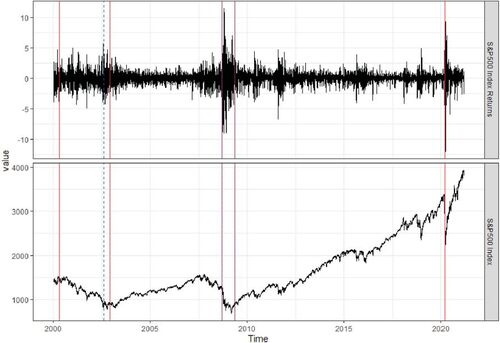
Table 3 Detection results on calibrated data.
Fig. 2 Variation of eight commonly used risk factors from January 01, 2000 to February 28, 2021. The estimated break dates are April 19, 2001, July 01, 2008, September 12, 2008, May 13, 2009 and March 06, 2020 (in red lines).
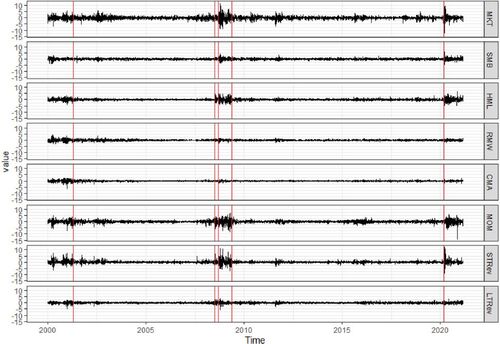
Table 4 Canonical correlation between estimated factors and observed factors.
