
Figures & data
Fig. 1 Cumulative (null) distribution function of Wald statistic under narrative proxy.
NOTE: Dashed lines represent 68th and 95th percentiles; data-generating process assumes T = 1000, and
; null distribution approximated using 100,000 Monte Carlo replications.
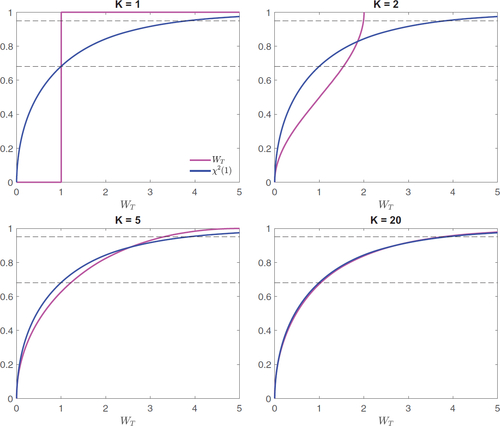
Table 1 Weak-proxy robust inference—Monte Carlo results for .
Table 2 Weak-proxy robust inference—Monte Carlo results for .
Table 3 Robust Bayesian inference—Monte Carlo results for .
Table 4 Robust Bayesian inference—Monte Carlo results for .