Figures & data
Table 1 Coverage rates (%) of 95% prediction intervals for one-step ahead forecasts.
Table 2 Values of for the performance of mixture-FAR model relative to the corresponding nonstationary-FAR model.
Table 3 Mean of the estimated number of factors.
Table 4 Performance of mixture-FAR relative to AR(4), in terms of .
Table 5 Values of for mixture-FAR compared to the nonstationary-FAR.
Fig. 1 Time series plots of and
for 1959:Q1 – 2018:Q4.
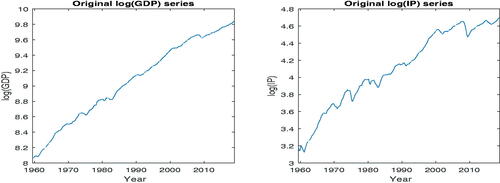
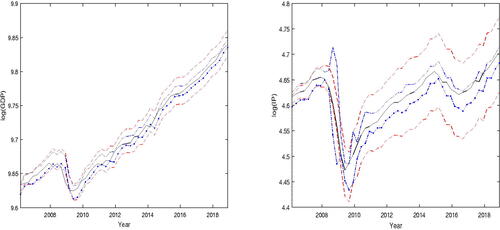
Fig. 2 Left Panel: One-step ahead point-wise 95% prediction intervals for using mixture-FAR. The solid line in the middle is the observed values of
. The pair of dashed lines is the asymptotic theory prediction interval; they are easily identified since one curve appears at the top and the other at the bottom, in 2016. The pair of curves with dash and dot, provide the bootstrap prediction interval. Right Panel: The legend is the same as that for the panel on the left, except that GDP is replaced by IP.