
Figures & data
Fig. 1 Average estimation errors of moderate-dimensional VAR models with different combinations of against sample size. Refer to for details.
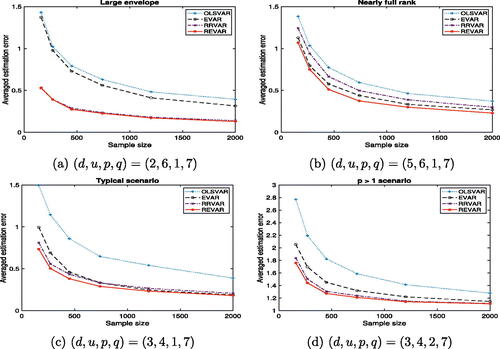
Table 1 Total number of parameters (NOP) in each VAR model correspond to Figure 1.
Fig. 2 Average estimation errors of higher-dimensional VAR models with different combinations of against sample size. Refer to for details.
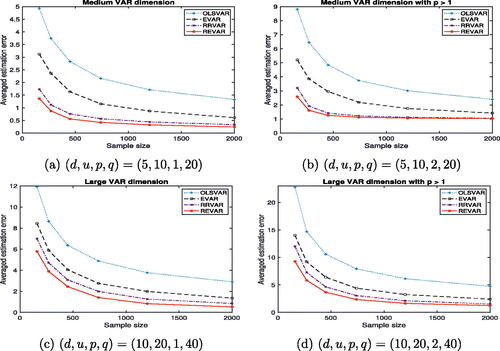
Table 2 Total number of parameters (NOP) in each VAR model correspond to .
Fig. 3 Minimum (left panels) and maximum (right panels) asymptotic standard error ratios of coefficient estimates for each VAR model with respect to the proposed REVAR model.
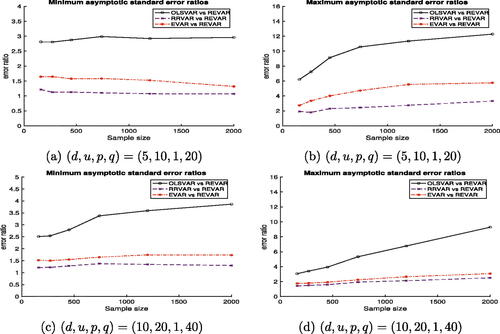
Fig. 4 Average estimation errors for with Normal, Uniform, t-Student, and Chi-square
distributions, plotted against sample size. Refer to for details.
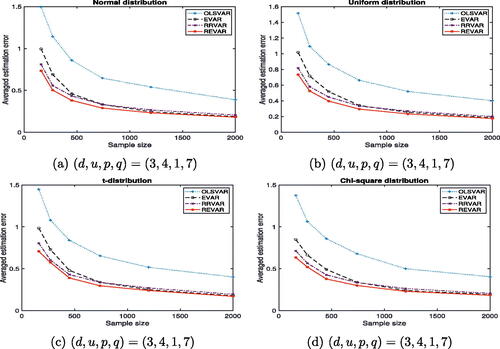
Fig. 5 Average estimation errors of moderate-dimensional VAR models with different for stochastic volatility martingale difference sequence (SV-MDS) errors against sample size.
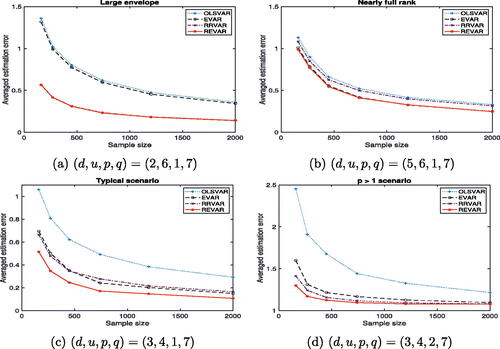
Table 3 Percentage selection of the true dimensions (d and u) and lag order (p).
Table 4 Pseudo-real-time forecasting performance with bootstrap for the NIPA dataset (1959Q1-2019Q4) using an expanding window scheme, evaluated from 2005Q1 to 2019Q4.
Table 5 Pseudo-real-time forecasting performance with bootstrap for the Price dataset (1959Q1-2019Q4) using an expanding window scheme, evaluated from 2005Q1 to 2019Q4.
Table 6 Pseudo-real-time forecasting performance with bootstrap for the initial 43 out of 47 macroeconomic variables in Table S6 (1959Q1-2019Q4), evaluated from 2005Q1 to 2019Q4 using an expanding window scheme.