
Figures & data
Table 1 Empirical sizes of the tests for at 5% level based on asymptotic critical values.
Table 2 Empirical sizes of the tests for at 5% level based on bootstrap critical values.
Fig. 1 Asymptotic power of the traditional and self-normalized Wald-type tests for at the nominal 5% level under local alternatives
. Note: The power curves for
and
coincide.
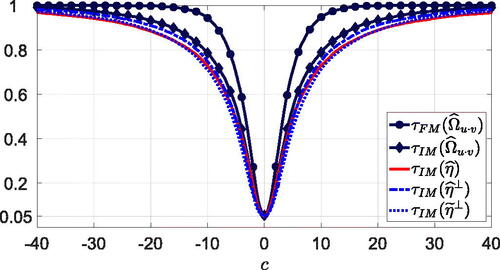
Fig. 2 Size-corrected power of the tests for at 5% level based on asymptotic critical values (top row) and bootstrap critical values (bottom row) for T = 100 and
. Note: Long-run variance parameters are estimated using the Bartlett kernel and the VAR sieve bootstrap is based on AIC.
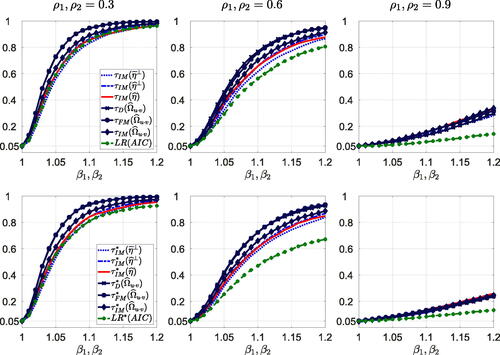
Table 3 Realizations of test statistics for .
JBES-P-2022-0187_Revision2_Unblinded_OnlineAppendix.pdf
Download PDF (651.2 KB)Data Availability Statement
MATLAB code for empirical applications is available on www.github.com/kreichold/CointSelfNorm