Figures & data
Table 1 Comparing different sorting methods for various combinations of N and d in terms of CPU time (in seconds): I: The fast Euclidean sorting algorithm, II: Choppala et al. (Citation2016) sorting method, and III: Hilbert sorting method.
Table 2 Comparing the variance of the log of the estimated likelihood for five different estimators of the likelihood: I: Averaging the likelihood (0% trimmed mean), II: Averaging the likelihood (5% trimmed mean), III: Averaging the likelihood (10% trimmed mean), IV: Averaging the likelihood (25% trimmed mean), and V: Averaging the likelihood (50% trimmed mean), for d = 10 dimensional linear Gaussian state space model with T = 300.
Table 3 Comparing the performance of different PMMH samplers with different number of particle filters S and different number of particles N in each particle filter for estimating the linear Gaussian state space model using a simulate dataset with T = 300 and d = 10 dimensions.
Table 4 Comparing the performance of different PMMH samplers with different number of particle filters S and different number of particles N in each particle filter for estimating multivariate GARCH diffusion-driven volatility in mean model using a real dataset with T = 100 and d = 30.
Table 5 Comparing the performance of different PMMH samplers using different number of particle filters S and different number of particles N in each particle filter for estimating the small scale DSGE model using a real dataset with T = 124 observations.
Table 6 Comparing the performance of different PMMH samplers using different numbers of particle filters S and different numbers of particles N in each particle filter for estimating the medium scale DSGE model using the U.S. quarterly dataset from 1983Q1 to 2007Q4.
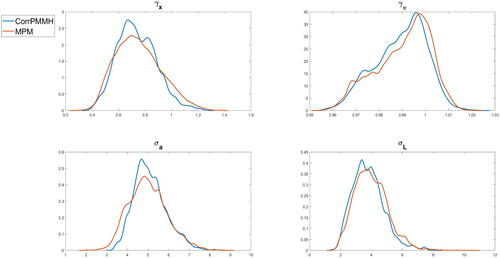
Fig. 1 Kernel density estimates of the posterior densities of some parameters of the medium scale DSGE model for the U.S. quarterly dataset from 1983Q1 to 2007Q4 estimated using: (a) MPM with 50% trimmed mean (, disturbance sorting, ADPF) with S = 250 and N = 100; (b) correlated PMMH with
. The measurement error variances are fixed to 25% of the variance of the observables.