Figures & data
Figure 1: Quarterly U.S. series covering the period from 1954Q3 to 2021Q4. From the top to the bottom, the first three panels present the log-differences of real GDP (GDP), GDP implicit price deflator (GDPDEF), and producer price index (PPI) multiplied by hundred. The fourth panel presents an interest rate variable, which is the effective federal funds from 1954Q3 to 2008Q2 and the Wu and Xia (Citation2016) shadow rate from 2008Q3 to 2021Q4. The bottom panel shows the estimated mixing weights of the first regime of the fitted VAR model with two volatility-regimes. The shaded areas indicate the NBER based U.S. recessions.
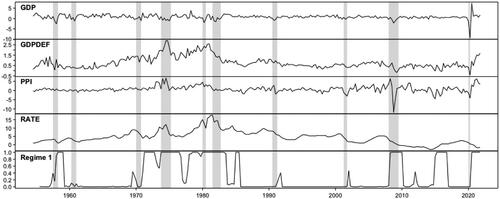
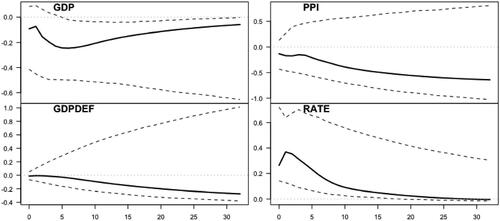
Figure 2: Impulse response functions quarters ahead for a one-standard-error monetary policy shock. The IRFs of the GDP (top left), GDP deflator (bottom left), and producer price index (top right) are accumulated to log-levels. The IRF of the interest rate variable is presented in the bottom right figure. Point estimates are presented with solid line and bootstrapped
confidence bounds (based on 2500 replications) are presented with dashed lines.