Figures & data
Table 1. Descriptive statistics for U.S. and German case study regions 2002, 2015.
Figure 1. Employment concentrations in U.S. city regions 2002, 2015. Notes: Delineation of case study regions based on 60-minute travel time isochrones (Atlanta, Seattle) or 45 minutes (Pittsburgh), given a free-flow road network. Source: Own calculations.
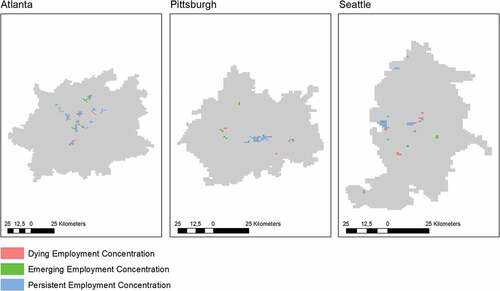
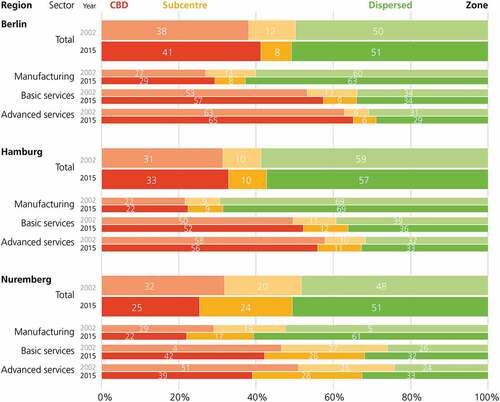
Figure 2. Employment concentrations in German city regions 2002, 2015. Notes: Delineation of case study regions based on 60-minute travel time isochrones (Berlin, Hamburg) or 45 minutes (Nuremberg), given a free-flow road network. Source: Own calculations.
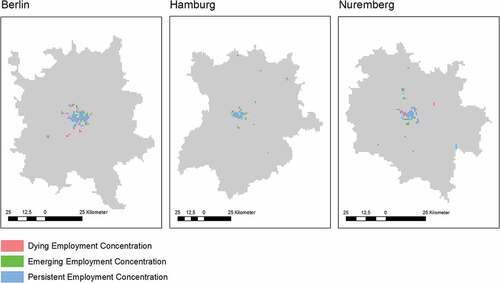
Table 2. Descriptive statistics of employment concentrations in U.S. and German city regions 2002, 2015.
Table 3. Size distribution of employment concentrations in U.S. and German city regions 2002, 2015.
Figure 3. Spatial distribution of employment in U.S. city regions 2002, 2015. Source: Own calculations based on United States Census Bureau (2020).
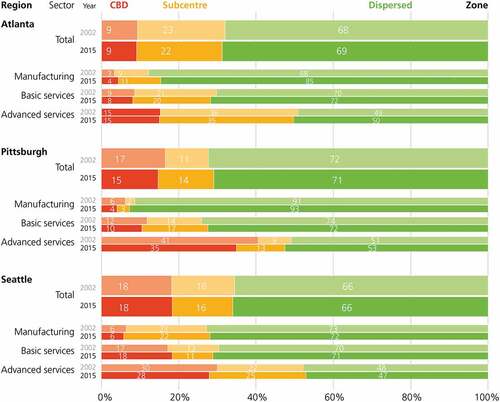
Figure 4. Spatial distribution of employment in German city regions 2002, 2015. Source: Own calculations based on Institut für Arbeitsmarkt und Berufsforschung (2020).