
Figures & data
Table 1. Mobility indicators for the childhood mobility trajectories of children born in metropolitan areas who moved (N = 30,675).
Table 2. Socioeconomic characteristics of origin neighborhoods in metropolitan areas.
Figure 1. Local spatial autocorrelation (Moran’s I) of neighborhood (a) childhood mobility rates and (b) socioeconomic status; and bivariate local spatial autocorrelation (Moran’s I) of neighborhood childhood mobility rates and socioeconomic status for (c) the total country and (d) metropolitan areas. (p < .05).
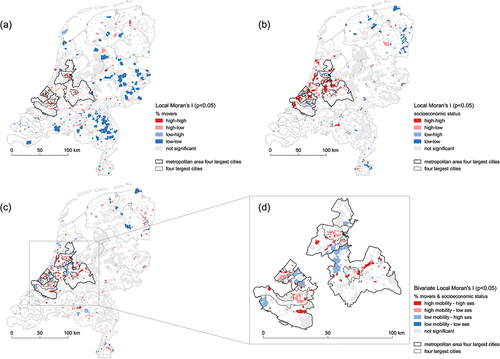
Table 3. Descriptive statistics on the selected study population for all children born in the Netherlands (N = 169,870) and children born in the metropolitan areas (N = 45,784).
Figure 2. Relative risk ratios childhood mobility trajectories (ref. = non-movers) by neighborhood of origin SES quintile (ref. = intermediate) controlling for background characteristics for children born in the metropolitan areas (N = 45,784).
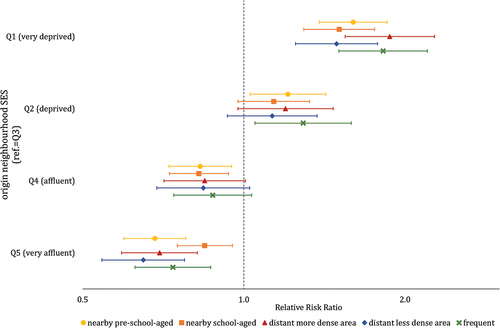
Figure 3. Years of exposure to neighborhood deprivation by childhood mobility trajectory (ref.=non-movers) controlling for background characteristics for children born in the metropolitan areas (N = 45,784) and by neighborhood of origin SES (Q1: N = 13,170; Q2: N = 5,249; Q3 = 5,256; Q4: N = 7,719; Q5 = 14,390).
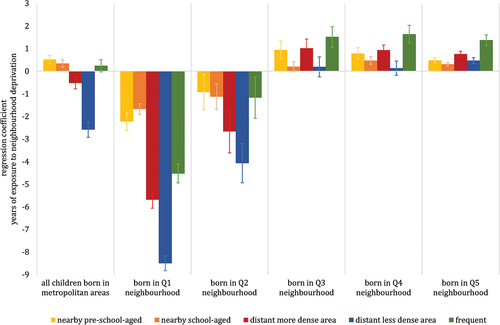
Table A1. Relative risk ratios (RRR) multinomial logistic regression of childhood mobility trajectories for children born in the metropolitan areas.
Table A2. Beta coefficients linear regression of duration of exposure to neighborhood deprivation for children born in the metropolitan areas and separate models by neighborhood of origin SES quintiles.