
Figures & data
Table 1. Network-level characteristics of the meeting and information networks.
Figure 1. Clusters in the meeting network.
Note. Clustering coefficient = 0.06; Modularity = 0.35. Source: Author.
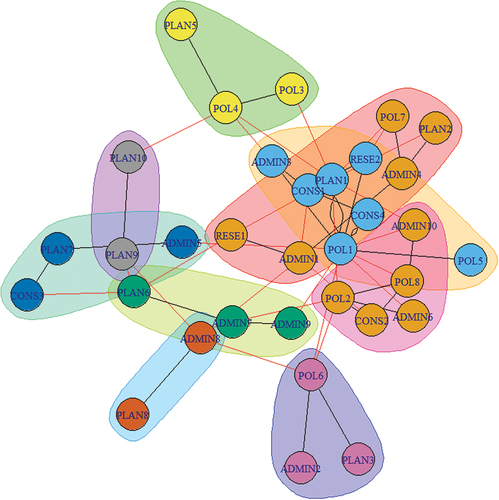
Figure 2. Clusters in the information-sharing network.
Note. Clustering coefficient = 0.40; Modularity = 0.14. Source: Author.
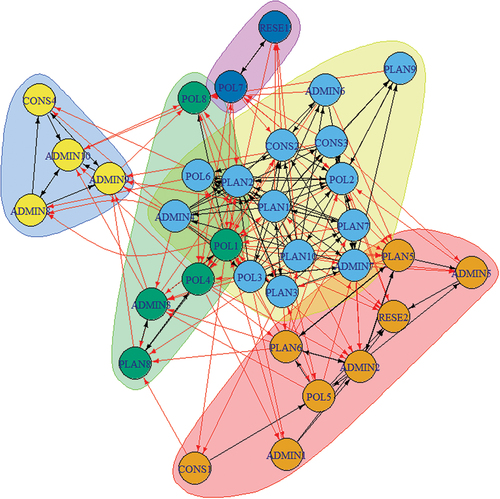
Figure 3. Core and periphery in the meeting network.
Source: Author.
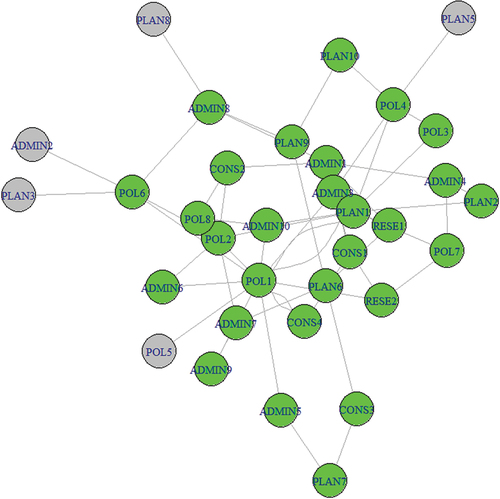
Figure 4. Core and periphery in the information-sharing network.
Source: Author.
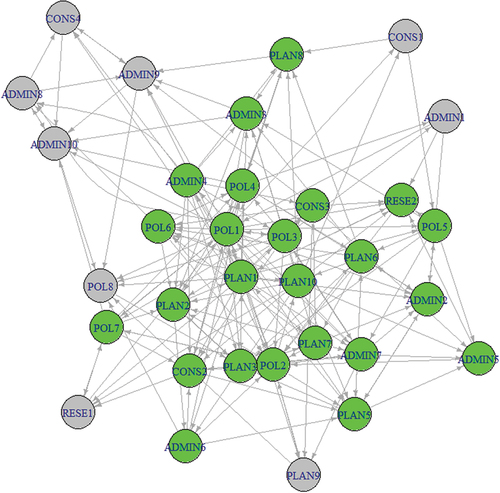
Table A1. Summary of the socio-demographic characteristics of study participants (n = 33).
Table A2. Actors and their affiliation in the Gartnerløkka project.