Figures & data
Table 1. Human Colon Tissue Samples Analyzed by ACB-PCR
Figure 1. Fluorescent ACB-PCR products were quantified following polyacrylamide gel electrophoresis. Equal volumes of the ACB-PCR reactions (MF standards and unknowns) were electrophoresed through polyacrylamide gels, along with a DNA length marker (not shown), and analyzed by fluorescent imaging. (A) K-RAS codon 12 GAT ACB-PCR products; (B) K-RAS codon 12 GTT ACB-PCR products. Two of the three replicate ACB-PCR analyses are presented. Mucosa samples are labeled as follows: Nor: normal mucosa from individuals without colon cancer; TDM: tumor-distal mucosa (≥5 cm from a tumor); TPM: tumor-proximal mucosa (2–5 cm from a tumor); and NTA: normal tumor-adjacent. Examples of the standard curves used to quantify the levels of K-RAS MF in each unknown sample are provided. (C) K-RAS codon 12 GAT standard curve; (D) K-RAS codon 12 GTT standard curve. The dotted lines in (C) and (D) correspond to the average pixel intensity of the two no-mutant control samples (i.e., the technical background of the assay).
Figure 2. K-RAS codon 12 GAT and GTT MF measurements by sample type and subject. (A) The average K-RAS GAT MFs (black circles) and K-RAS GTT MFs (grey circles) calculated from the three independent ACB-PCR measurements are plotted. Error bars denote standard deviation. The dashed line at a MF of 0.5 corresponds to the MF expected in monoclonal tumors initiated by a single K-RAS mutant cell. (B) MFs are plotted for the different tissue types (TDM: tumor-distal mucosa; TPM: tumor-proximal mucosa; adenoma; and carcinoma) measured in particular subjects (left panel) and for normal tumor adjacent (NTA), adenoma, and carcinoma samples collected from the CHTN (right panel). The dotted line at 10−5 corresponds to the limit of accurate ACB-PCR quantification.
Table 2. Summary of K-RAS Mutant Fraction Measurements by Tissue Type
Figure 3. Box and whisker plots of the frequency distributions for the K-RAS codon 12 GAT and GTT MFs measured for each type of tissue. Whiskers denote the 10th and 90th percentiles of each distribution, with all outliers indicated by black circles. The dotted line corresponds to the limit of accurate ACB-PCR quantitation, a MF of 10−5.
Figure 4. K-RAS codon 12 GAT and GTT MFs are plotted as a function of subject age. (A) The average K-RAS codon 12 GAT MFs measured in individuals without a colon tumor, in tumor-distal mucosa samples, and tumor-proximal mucosa samples are plotted relative to subject's age. (B) The average K-RAS codon 12 GTT MFs measured in individuals without a colon tumor, in tumor-distal mucosa samples, and tumor-proximal mucosa samples are plotted relative to subject's age. Dashed lines indicate the limit of accurate ACB-PCR quantitation (10−5).
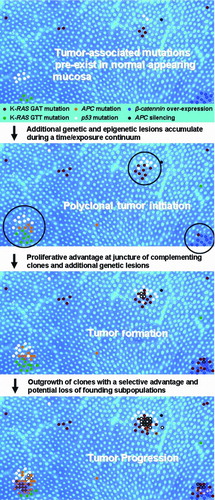
Figure 5. A spatially based model of polyclonal colon tumor initiation and progression. The model is based on the concept of polyclonal tumor initiation and features of the model represent the ideas that (1) mutations and epigenetic lesions pre-exist within normal colonic mucosa (APC, adenomatous polyposis coli); (2) additional mutations (both spontaneous and chemically induced) occur over time, along with expansion of pre-existing lesions; (3) tumor initiation occurs when complementing mutant clones or epigenetic lesions arise within close proximity, creating a competitive advantage for cells at the boundary of the two or more cell lineages (a process that may be manifested in the appearance of ACF); (4) additional genetic lesions accumulate in these hyper-proliferating cells (subsequent mutations denoted by colored outline and cross-hatch); and (5) oncogene-induced senescence and/or cell selection may eventually lead to the loss of particular cell lineages during tumor progression (e.g., K-RAS GTT mutation during adenoma to carcinomas progression).