
Figures & data
Figure 1. CONSORT flowchart of included patients. Flowchart of patients randomized to either the cognitive behavior therapy condition or the waiting-list condition. Only the participants who completed both baseline and follow-up IP-10 assessment were compared to non-fatigued patients in terms of baseline cytokine concentrations. Abbreviations: CBT: cognitive behavior therapy; WL: waiting list.
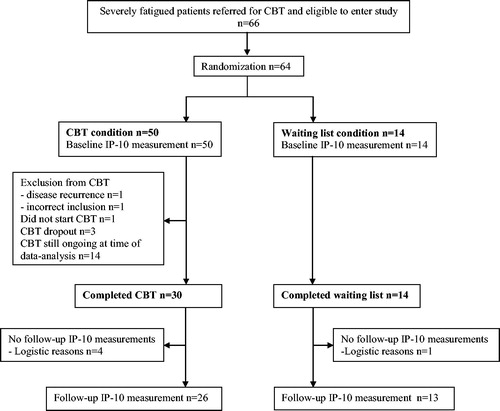
Table 1. Baseline characteristics of fatigued and non-fatigued patients (cross-sectional baseline comparison) and of fatigued patients in the therapy and waiting list condition (longitudinal comparison).
Figure 2. Longitudinal comparison of IP-10 concentration between CBT and WL condition. X-axis: Measurement at baseline and follow-up in the CBT and WL condition. Y-axis: IP-10 concentration in pg/mL. Abbreviations: CBT: cognitive behavior therapy; WL: waiting list.
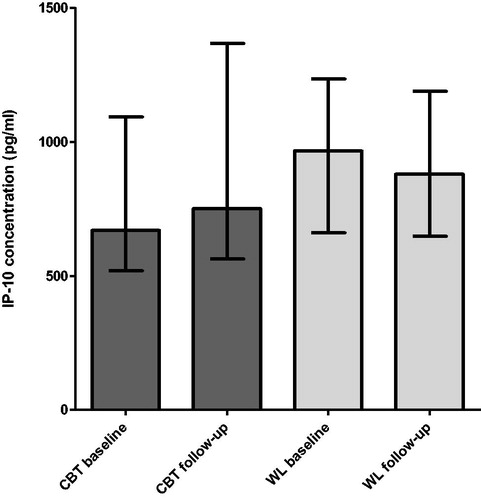
Table 2. Cross-sectional and longitudinal comparison of fatigue severity and IP-10 concentration.