Figures & data
Figure 1. The bias-variance trade-off in randomized controlled trials (RCTs). The trial and model are designed based on prior knowledge, which informs the choice of the statistical test to be used, the variables to be included in the model, and whether or not to focus on parsimony or account for anticipated patient heterogeneity. For Bayesian models, prior probabilities are also needed. Once the RCT is activated, it may enroll a diverse patient population. The final data may then be analyzed using either a parsimonious (A) or a more complex (B) statistical model that accounts for patient heterogeneity. (A) In the first scenario, all of the enrolled patients are used to estimate one parameter for the relative treatment effect measured at the HR scale. The estimated HR will have higher bias (higher systematic error) because it assumes the heterogeneous enrolled patient population to be homogeneous, but lower variance (lower random error) because it uses every enrolled patient. (B) In the second scenario, the more complex model generates multiple HRs that take into account the diverse subgroups of patients enrolled, thus resulting in lower bias (lower systematic error). However, each estimated HR is based on a lower effective sample size, resulting in higher variance (higher random error). Figure adapted from images created with BioRender.com.
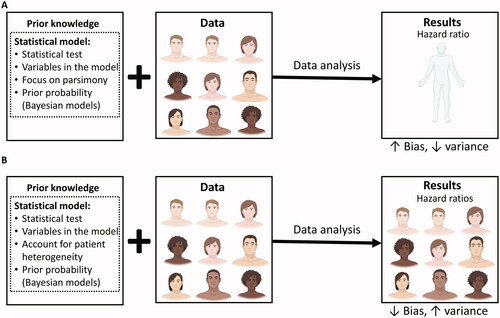
Table 1. Glossary of key terms.
Figure 2. The big data paradox. (A) Our target is the underlying true parameter, but its complexity can never be perfectly modeled (B) Therefore, there will always be some distance between our models of the true parameter and the true parameter itself. This distance is the sum of the bias (blue line) due to constraints and other assumptions imposed by the statistical model, and of the irreducible error (brown line) due to unknown elements that are not represented within the dataset. (C) When the sample size of a study is small, then the variance is large, yielding wide confidence intervals around the estimated parameter that are more likely to include the true parameter value. (D) If the same study has a larger sample size, then the reduced variance will yield more narrow confidence intervals that are less likely to include the true parameter.
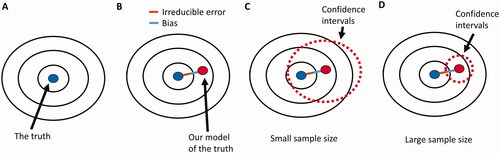
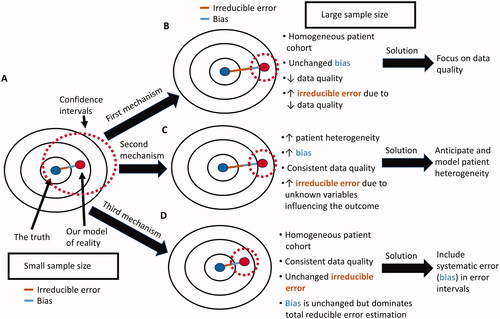
Figure 3. Potential causes of the big data paradox in an RCT. (A) when the sample size of the RCT is small, the corresponding wide CIs may include the true parameter of interest, e.g. the true HR for the relative treatment effect of one treatment versus another. (B) As the sample size of the RCT increases, the quality of the gathered data may decrease, resulting in increased irreducible error within the dataset even if the enrolled patient cohort was highly homogeneous and the statistical model bias remains the same. This can be addressed by maintaining high data quality throughout the study. (C) As the sample size of the RCT increases, the heterogeneity of the patient cohort may also increase, resulting in both increased bias and increased irreducible error, even if the data quality remains consistently high throughout the study. This can be addressed by both anticipating and modeling patient heterogeneity in the estimation of the HR. (D) As the sample size of the RCT increases, the reducible error of the estimated parameter is dominated by the systematic error (bias) and is not properly represented by CIs that are a function of the standard error (variance). This occurs even if the enrolled patient cohort is highly homogeneous and data quality remains consistently high throughout the study. It can be addressed via the use of error intervals that represent the reducible error due to both systematic and standard error.