
Figures & data
Figure 1. Overall flow chart of study subject selection and follow-up of K-DETEK. K-DETEK is a multi-center, prospective cohort study recruiting participants aged 40 or older who present at the Outpatient Clinic of one of the 13 hospitals and research institutes in five regions in Vietnam for periodic follow-up visits for their chronic conditions or for annual health check-ups beginning in April 2022. The estimated number of participants to be enrolled in the study is 3000. The inclusion criteria include: (i) 40 years of age or older, (ii) have neither clinical suspicion of cancer nor history of confirmed cancer, (iii) agree to be contacted at 6 months and 12 months following enrollment to collect information about general health status and progress of cancer, (iv) have no history of blood transfusion or bone marrow transplantation within the past 3 years, and (v) have no clinical manifestation of dementia. Eligible participants provided 10 ml of blood for analyzing cfDNA by SPOT-MAS assay. After 30 days, each participant received the results of either “ctDNA signal detected” or “ctDNA signal not detected.” The study participants were scheduled for follow-up visits at 6 and 12 months. This study reported interim results of 2795 participants 6 months from study initiation.
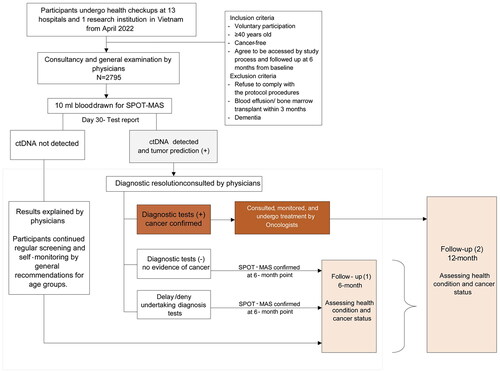
Table 1. Imaging tests for “signal-detected” cases.
Table 2. Clinical characteristics of 2795 study participants.
Figure 2. Geographical location of participating centers and their contribution to the total participants in K-DETEK study. (A) K-DETEK is a prospective, multi-center clinical study that enrolled 2795 participants from 13 hospitals and 1 research institute in Vietnam between April 2022 and July 2022. These research centers were grouped into five regions including two major cities (Hanoi and HCMC) and three remote regions (Central, Southeast and Mekong Delta). (B) Pie chart showing the distribution of participants across five regions.
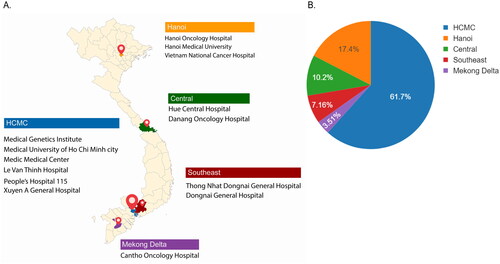
Figure 3. The influences of sample processing time and plasma hemolysis on sequencing library yield of cfDNA. (A,B) Bar plots showing the differences in logistic time (A) and plasma hemolysis rate (B). (C,D) Violin plots showing the impact logistic time (C) and plasma hemolysis rate (D) on cfDNA amount per ml plasma. (E,F) Violin plots showing the impacts of sample processing time (E) and hemolysis rates (F) on the efficiency of library yields. Mann–Whitney–Wilcoxon test two-sided with Bonferroni correction was performed to compare the fold changes in DNA library yields across different patient groups. ns: not significant; *, p < 0.05; ****, p < 0.00001.
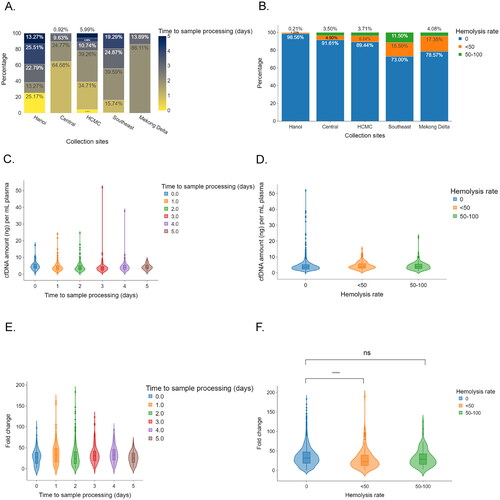
Figure 4. Association between participants’ clinical features and plasma cfDNA concentration. (A,B) Box plots showing the differences in cfDNA amount stratified by gender (A) and median age (B). (C) Box plots showing the differences in cfDNA stratified by both age and gender. (D) Box plots showing the differences in cfDNA concentration between medium risk and high-risk participants. Wilcoxon rank sum test performed to compare the median of cell free DNA amount across different patient groups. ***, p < 0.0001; ****, p < 0.00001.
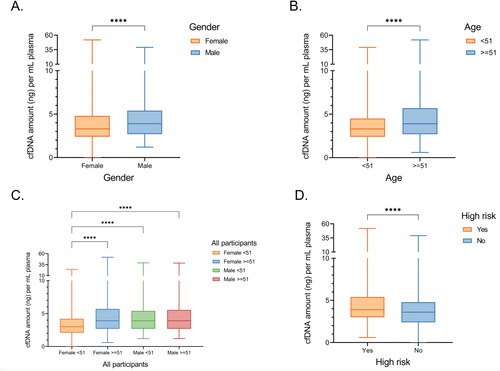
Table 3. Associations between participants’ clinical features and amount of cfDNA per ml plasma.
Table 4. Cases with signal-detected reports.
Table 5. SPOT-MAS performance and tumor origin accuracy.
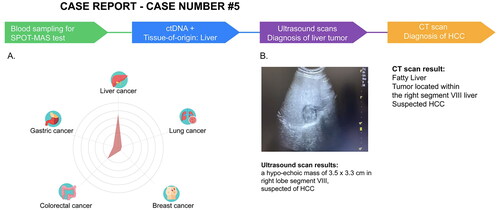
Figure 5. SPOT-MAS and confirmed diagnosis tests result of a case with detectable ctDNA in K-DETEK study. (A) A 60-year-old male (case#5) with unknown cancer status or symptoms was enrolled in K-DETEK study. His SPOT-MAS test was “ctDNA detected” and predicted to have liver cancer or colorectal cancer with probabilities of 75% and 25%, respectively. (B) After receiving the SPOT-MAS test result, the patient was recommended to undertake an ultrasound test, which revealed a hypo-echoic mass of 3.5 × 3.3 cm located in right lobe segment VIII of the liver, suspecting of hepatocellular carcinoma. His following CT-scan confirmed the presence of tumor in the same location.
Supplemental Material
Download PDF (320.9 KB)Data availability statement
Sequencing data will be deposited in a public portal database (NCBI SRA) upon acceptance and are available on request from the corresponding author, LST. The data are not publicly available due to ethical restrictions.