
Figures & data
Figure 1. Flowchart of this study. PSM: propensity score matching; Surg: surgery; ROC: receiver operating characteristic; DCA: decision curve analysis.
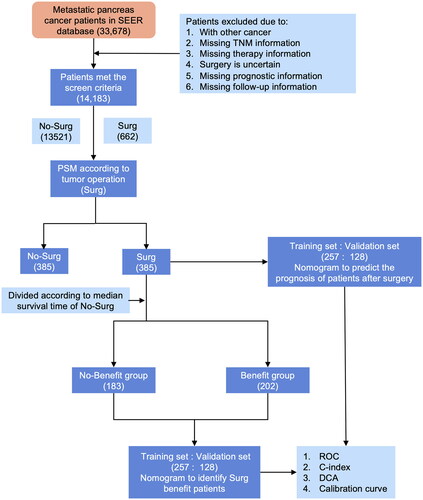
Table 1. Characteristics of the study population by study group before and after PSM.
Figure 2. Kaplan–Meier (KM) plots show the OS and CSS of mPC patients according to the group. (A) KM curves of OS for the surgery and nonsurgery groups before PSM, (B) KM curves of CSS for the surgery and nonsurgery groups before PSM, (C) KM curves of OS for the surgery and nonsurgery groups after PSM, (D) KM curves of CSS for the surgery and nonsurgery groups after PSM (p < 0.001). Surg: Surgery.
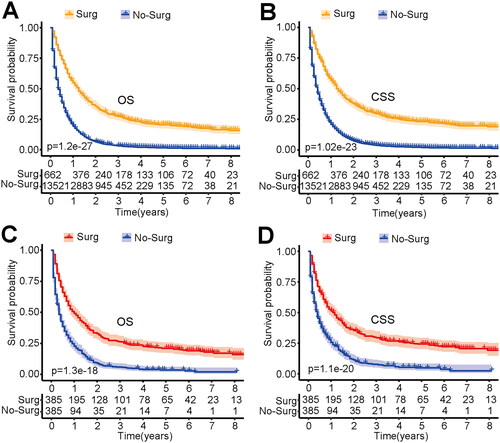
Figure 3. Nomogram to identify beneficial candidates for primary tumor surgery. (A) Nomogram for predicting which patients with mPC might benefit from primary tumor resection. The cutoff point of the nomogram was 0.5. The patient would be a benefit candidate when the overall prediction probability exceeds the threshold and vice versa. (B) ROC curve of the training set. (C) ROC curve of the validation set. (D) Calibration curve of the training set. (E) Calibration curve of the validation set. (F) DCA of the training set. (E) DCA of the validation set. Sex (F: female; M: male), Race (W: White; B: Black; AI: American Indian/Alaska Native; API: Asian or Pacific Islander), T: T Stage; N: N stage; Primary Site (PH: Pancreas head; PB: Pancreas body; PT: Pancreas tail; PO: Pancreas other); AUC: area under the receiver operating characteristic curve.
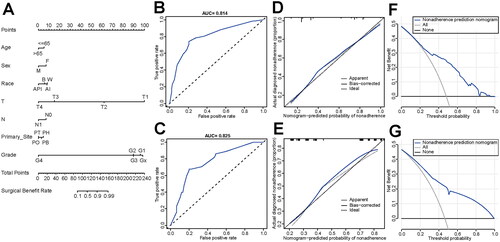
Figure 4. Prediction nomogram of OS after primary tumor surgery. (A) The nomogram includes age, sex, race, T stage, N stage, histological grade, and tumor location for predicting OS in postoperative patients. (B) ROC curves for 1-year OS and 2-year OS in the training set. (C) ROC curves for 1-year OS and 2-year OS in the validation set. (D) Calibration curves for 1-year OS and 2-year OS in the training set. (E) Calibration curves for 1-year OS and 2-year OS in the validation set. (F) DCA for 1-year OS and 2-year OS in the training set. (G) DCA for 1-year OS and 2-year OS in the validation set. Sex (F: female; M: male), Race (W: White; B: Black; AI: American Indian/Alaska Native; API: Asian or Pacific Islander); T: T Stage; N: N stage; Primary Site (PH: Pancreas head; PB: Pancreas body; PT: Pancreas tail; PO: Pancreas other); AUC: area under the receiver operating characteristic curve; OS: overall survival.
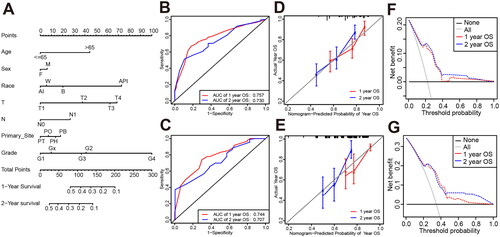
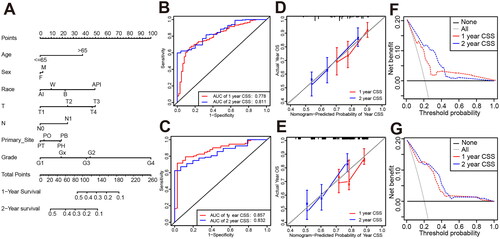
Figure 5. Prediction nomogram of CSS after primary tumor surgery. (A) The nomogram includes age, sex, race, T stage, N stage, histological grade, and tumor location for predicting CSS in postoperative patients. (B) ROC curves for 1-year CSS and 2-year CSS in the training set. (C) ROC curves for 1-year CSS and 2-year CSS in the validation set. (D) Calibration curves for 1-year CSS and 2-year CSS in the training set. (E) Calibration curves for 1-year CSS and 2-year CSS in the validation set. (F) DCA for 1-year CSS and 2-year CSS in the training set. (G) DCA for 1-year CSS and 2-year CSS in the validation set. Sex (F: female; M: male), Race (W: White; B: Black, AI: American Indian/Alaska Native; API: Asian or Pacific Islander); T: T Stage; N: N stage; Primary Site (PH: Pancreas head; PB: Pancreas body; PT: Pancreas tail; PO: Pancreas other); AUC: area under the receiver operating characteristic curve; CSS: cancer-specific survival.
Availability of data and materials
All data generated or analyzed during this study are included in this published article and raw data can download from Surveillance, Epidemiology, and End Results (SEER) database (www.seer.cancer.gov).