
Figures & data
Table 1. Overall performance of target enhanced -whole genome sequencing (TE-WGS).
Figure 1. Correlation of expected and observed variant allele fractions in the reference material. Observed variant allele fraction single nucleotide variants (A) and insertion and deletion variants (B) by TE-WGS were concordant with the expected variant allele fractions provided by the reference material manufacturer.
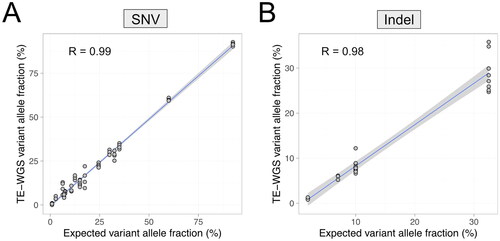
Figure 2. (A) KRAS G12V reference standard serial dilution to assess the limit of detection (LOD). The minimum LOD for SNVs has been established at a VAF of 5%. (B) Violin plot depicting depth distribution across all targets in four analytical validation (AV) samples. Notably, the KRAS locus exhibits lower coverage (red dot), suggesting higher depth and potentially lower LOD (enhanced sensitivity) for most other targets. Black dots represent mean values, while horizontal lines indicate medians.
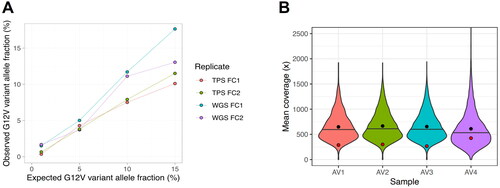
Table 2. Tumor types of the samples for clinical validation.
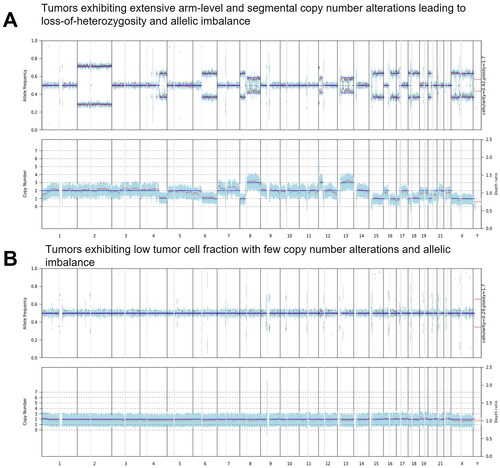
Figure 3. Comparative Analysis of Copy Number and Variant Allele Frequency (VAF) in Tumor Samples. (A) Demonstrates a tumor characterized by widespread chromosomal arm-level and segmental copy number alterations, indicative of significant loss-of- heterozygosity and allelic imbalance. (B) Illustrates a sample with a low tumor cell fraction, revealing minimal copy number changes and allelic imbalance.
Supplemental Material
Download PDF (5.3 MB)Data availability statement
The patients participating in this study did not consent to the public release of sequencing data. The TE-WGS pipeline and associated algorithms are proprietary to Inocras Inc.