
Figures & data
Figure 1. Top 50 abundances of microbiotas for GSVA. The GSVA analysis (Gene Set Variant Analysis) for the relationship between microbiota and immune cells. The abscissa represents top 50 abundances of microbiotas and the ordinate represents difference of immune cells infiltration between high and low microbiota group. If the difference is positive, it will be red, otherwise it will be blue. If no difference exists, it is yellow.
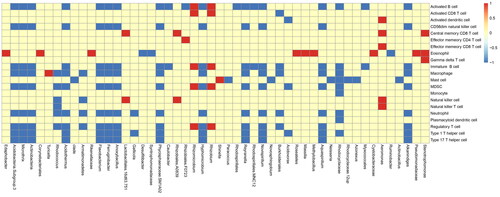
Figure 2. Top 50 abundances of microbiotas for CIB. The CIBERSORT analysis for the relationship between microbiota and immune cells. The abscissa represents top 50 abundances of microbiotas and the ordinate represents immune cells. If the difference between microbiota and immune cells is positive, it will be red, otherwise it will be blue. If no difference exists, it is yellow.
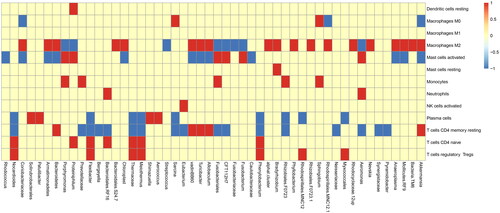
Figure 3. Top 50 abundances of microbiotas for Immune genes. Analysis for the relationship between microbiota and immune genes. The abscissa represents top 50 abundances of microbiotas and the ordinate represents immune genes. If the difference between microbiota and immune genes is positive, it will be red, otherwise it will be blue. If no difference exists, it is yellow.
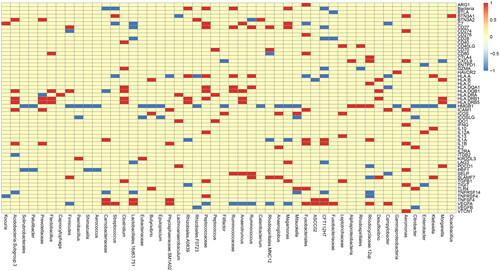
Table 1. Immune-related genes.
Figure 4. The Venn diagram and list of overlapping microbiota groups appeared in the four analyses. Microbiota groups that appeared simultaneously in the four analyses did not exist, and a total of 8 microbiota groups appeared in the three analyses.
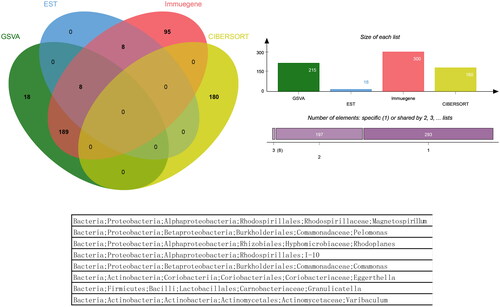
Figure 5. Expression analysis of microbial populations according to clinical parameter (CRC_STAGE) were performed by using ANOVA.
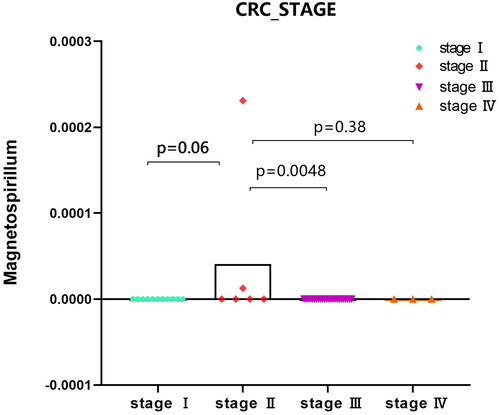
Figure 6. Expression analysis of microbial populations according to clinical parameter (FAMILY_HISTORY_CRC_Magnetospirillum) were performed by using Mann-Whitney U test.
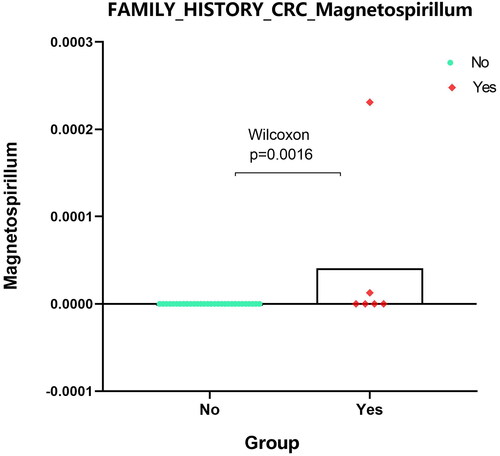
Figure 7. Expression analysis of microbial populations according to clinical parameter (BMI_Varibaculum) were performed by using Mann-Whitney U test.
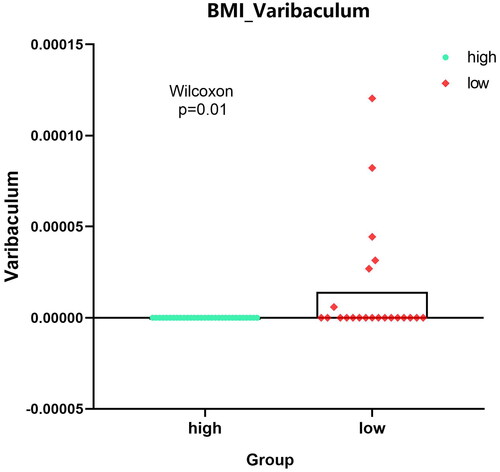
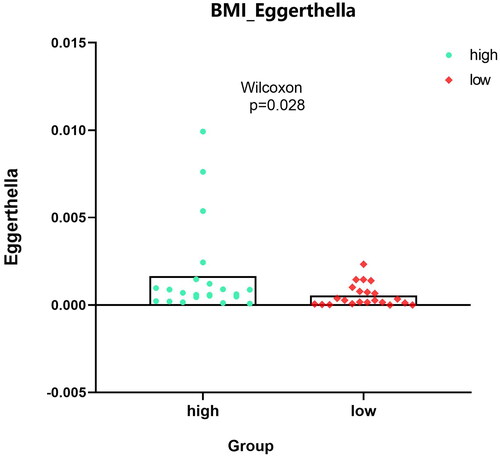
Figure 8. Expression analysis of microbial populations according to clinical parameter (BMI_Eggerthella) were performed by using Mann-Whitney U test.
Supplemental Material
Download PDF (5.8 MB)Data availability statement
All data sets for this study are included in the GEO (https://www.ncbi.nlm.nih.gov/geo/) GSE165255 dataset for the database.