
Figures & data
Table 1. Patients’ characteristics.
Figure 1. (a) Comparison of BI values of patients in the discharge-home group at the start of rehabilitation and at discharge; (b) Comparison of BI values of patients in the hospital transfer group at the start of rehabilitation and at discharge. BI: Barthel index.
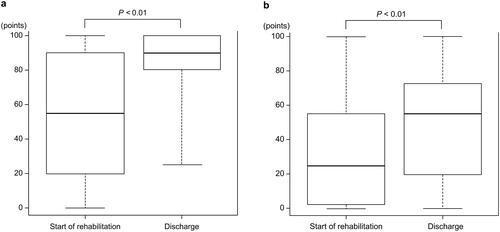
Table 2. Location of the tumor and initial treatment type in included patients with glioblastoma.
Table 3. BI comparison at the start of rehabilitation for each initial treatment.
Table 4. BI comparison at discharge for each initial treatment.
Table 5. BI comparison at the start of rehabilitation and at discharge for each initial treatment.
Table 6. Analysis of factors influencing discharge destination.
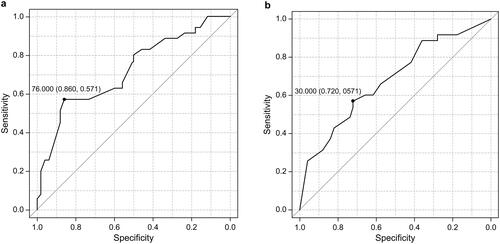
Figure 2. (a) ROC curve for age. The cut-off value was 76 years of age, specificity was 0.860, sensitivity was 0.571, and AUC was 0.72; (b) ROC curve for BI at the start of rehabilitation. The cut-off value was 30 points, specificity was 0.720, sensitivity was 0.571, and AUC was 0.68. ROC: receiver operating characteristic; AUC: area under the curve.
Data availability statement
Data sharing is not applicable to this article as no new data were created or analyzed in this study.