

Figures & data
Figure 1. Overview of adipocyte flow cytometry methodology.
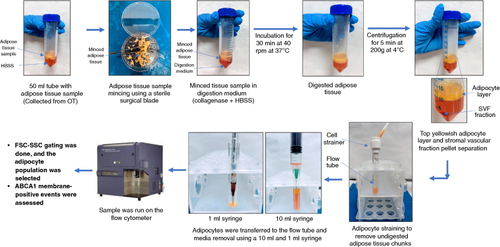
Figure 2. Selection of adipocyte population using DAPI as positive stain in unstained (A) and stained (B) sample.
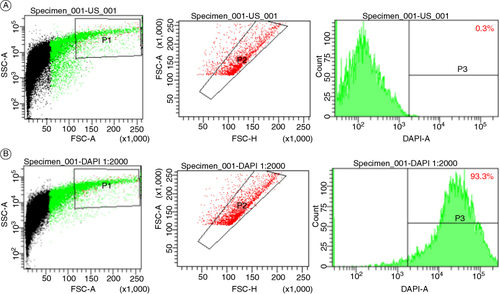
Figure 3. Selection of adipocyte population and assessment of membrane-bound ABCA1 in normal weight individuals in unstained (A) and stained (B) sample.
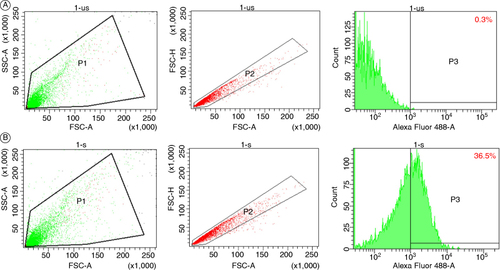
Figure 4. Selection of adipocyte population and assessment of membrane bound ABCA1 in high BMI individuals in unstained (A) and stained (B) sample.
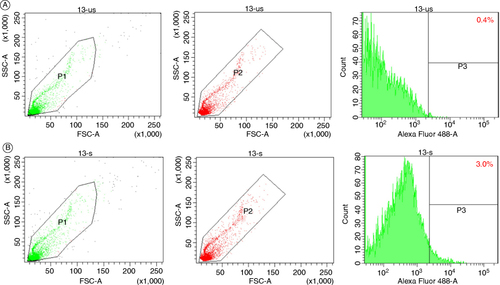
Table 1. (A) Summary of the % ABCA1 positive events in unstained and stained samples in normal weight participants.
Supplemental material

