
Figures & data
Figure 1. Structures of TREN-DGA, i-Pr3-TREN-DGA, TRPN-DGA, T-DGA, TAETEB, TODGA, and TREN-G1-DenDGA.
Figure 2. Schematic diagram of the glass transport cell used in the present study.
Figure 3. Extraction and stripping kinetics of (a) Np(IV), (b) Pu(IV) and (c) Th(IV) ions. Extraction: [TREN-G1-DenDGA]: 5.75 × 10⁻⁴ M in 5% isodecanol-95% n-dodecane; Aqueous phase: 3 M HNO3 containing the metal ions. Stripping: Organic phase: Above extracted complex; Aqueous phase: 1 M α-HIBA.
![Figure 3. Extraction and stripping kinetics of (a) Np(IV), (b) Pu(IV) and (c) Th(IV) ions. Extraction: [TREN-G1-DenDGA]: 5.75 × 10⁻⁴ M in 5% isodecanol-95% n-dodecane; Aqueous phase: 3 M HNO3 containing the metal ions. Stripping: Organic phase: Above extracted complex; Aqueous phase: 1 M α-HIBA.](/cms/asset/ead293d3-5934-4431-8e6e-496cd13a2a24/lsei_a_2074501_f0003_oc.jpg)
Table 1. Stripping of Np(IV) extract in 5.75 × 10 −4 M TREN-G1-DenDGA in 5% isodecanol-95% n-dodecane with different stripping agents.
Figure 4. DNp(IV) at varying concentrations of (a) nitric acid with [TREN-G1-DenDGA]: 5.75 × 10⁻⁴ M in 5% isodecanol-95% n-dodecane and (b) TREN-G1-DenDGA at 3 M HNO3; Temperature: 25ºC.
![Figure 4. DNp(IV) at varying concentrations of (a) nitric acid with [TREN-G1-DenDGA]: 5.75 × 10⁻⁴ M in 5% isodecanol-95% n-dodecane and (b) TREN-G1-DenDGA at 3 M HNO3; Temperature: 25ºC.](/cms/asset/50367d78-140d-4596-b602-f89d943473c9/lsei_a_2074501_f0004_b.gif)
Table 2. DNp(IV) values with different ligands in 5% isodecanol-95% n-dodecane at 3.0 M HNO3.
Figure 5. Transport profile of Np(IV) across flat sheet SLMs from 1 M, 3 M and 6 M HNO3 feed solutions using 5.75 × 10⁻⁴ M TREN-G1-DenDGA in 5% isodecanol-95% n-dodecane. Stripping solution in receiver is 1 M α-HIBA.
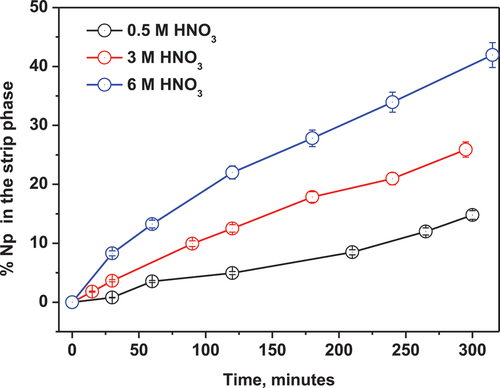
Table 3. Slopes of log–log plot of DNp(IV) versus TREN-G1-DenDGA concentration; extraction carried out at 3 M HNO3.
Table 4. Transport of Np(IV) from different feed nitric acid concentrations after 5 h. Receiver phase: 1 M α-HIBA, [Ligand]: 5.75 × 10⁻⁴ M TREN-G1-DenDGA in 5% isodecanol-95% n-dodecane.
Figure 6. Transport profile of Np(IV) across flat sheet SLMs from 3 M HNO3 feed solutions using different concentrations of TREN-G1-DenDGA in 5% isodecanol-95% n-dodecane. Stripping solution in receiver is 1 M α-HIBA.
Table 5. Transport of Np(IV) with different ligand concentrations in the membrane. Feed: 3 M nitric acid; Receiver phase: 1 M α-HIBA; [Ligand]: TREN-G1-DenDGA in 5% isodecanol-95% n-dodecane; Data after 5 h.
Figure 7. Transport profile of different actinide ions across a flat sheet supported liquid membrane from 3 M HNO3 as feed phase and 1 M α-HIBA as stripping phase. [Ligand]: 4.42 x 10⁻³ M TREN-G1-DenDGA in 5% isodecanol-95% n-dodecane.
![Figure 7. Transport profile of different actinide ions across a flat sheet supported liquid membrane from 3 M HNO3 as feed phase and 1 M α-HIBA as stripping phase. [Ligand]: 4.42 x 10⁻³ M TREN-G1-DenDGA in 5% isodecanol-95% n-dodecane.](/cms/asset/c1c08f87-7e0c-4b88-99e5-d34c91d144d8/lsei_a_2074501_f0007_b.gif)
Figure 8. Lag-Time of Np(IV) transport across a flat sheet SLM from 3 M HNO3 as feed phase and 1 M α-HIBA as stripping phase. [Ligand]: 4.42 x 10⁻³ M TREN-G1-DenDGA in 5% isodecanol-95% n-dodecane.
![Figure 8. Lag-Time of Np(IV) transport across a flat sheet SLM from 3 M HNO3 as feed phase and 1 M α-HIBA as stripping phase. [Ligand]: 4.42 x 10⁻³ M TREN-G1-DenDGA in 5% isodecanol-95% n-dodecane.](/cms/asset/5d76c188-6af9-4993-a96d-40b3c5bd5805/lsei_a_2074501_f0008_b.gif)
Table 6. Transport of different actinides from 3 M HNO3 as feed acidity after 5 h. Receiver phase: 1 M α-HIBA; [Ligand]: 4.42 × 10⁻³ M TREN-G1-DenDGA in 5% isodecanol-95% n-dodecane.
Scheme 1. Pictorial depiction of the transport mechanism.
Table 7. Diffusion coefficients of Np(IV) determined by the lag-time and Wilke-Chang equations. Feed: 3 M HNO3; Receiver: 1 M α-HIBA; [L]: 4.42 × 10 −3 M TREN-G1-DenDGA in 5% isodecanol-95% n-dodecane.
Figure 9. Stability of the SLMs for Np(IV) transport studies. Feed: 3 M HNO3; Strip: 1 M α -HIBA; [Ligand]: 4.42 x 10⁻³ M TREN-G1-DGA in 5% isodecanol-95% n-dodecane.
![Figure 9. Stability of the SLMs for Np(IV) transport studies. Feed: 3 M HNO3; Strip: 1 M α -HIBA; [Ligand]: 4.42 x 10⁻³ M TREN-G1-DGA in 5% isodecanol-95% n-dodecane.](/cms/asset/cf1f4a05-4fb3-4380-b4f6-b336e4f1314d/lsei_a_2074501_f0009_oc.jpg)
Table 8. Stability of the SLMs for Np(IV) transport studies. Feed nitric acid concentration: 3 M; Receiver phase: 1 M α-HIBA; [Ligand]: 4.42 × 10⁻³ M TREN-G1-DGA in 5% isodecanol-95% n-dodecane. Data after 5 h.