Figures & data
Table 1. Participants’ general characteristics (n = 499)
Table 2. Hypertension, diabetes mellitus (DM), and total cholesterol changes since registration
Table 3. Factors associated with changes in blood pressure, blood glucose, and total cholesterol levels
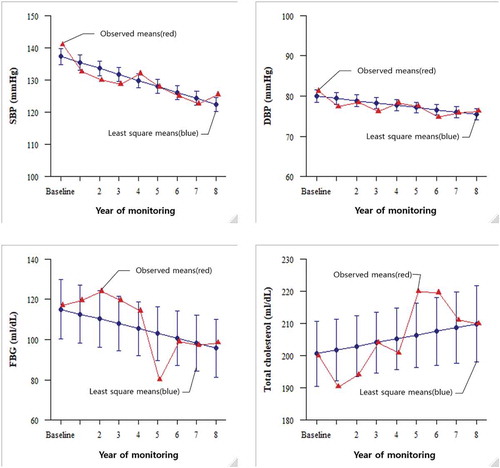
Figure 1. Changes in blood pressure, blood glucose, and total cholesterol levels in participants during the monitoring period
† Changes in outcome measurements for home health care nursing among frail older adults. Navy circles indicate the least square means on mixed model of repeated measures analysis after adjusting for age, sex, economic status, number of family members, and number of diseases. Red triangles indicate the observed means.SBG = systolic blood pressure; DBG = diastolic blood pressure; FBG = fasting blood glucose.