Figures & data
Table 1. Experimental parameters used to calculate the capillary number and Bond number.
Figure 1. Schematic diagram of NMR set-up. The step motor is used to position the sample in the NMR set up.
Figure 2. This figure shows (a) TGA curve for different weight percentage MHEC and (b) corresponding calibration curve plotted for different weight percentage MHEC solution.
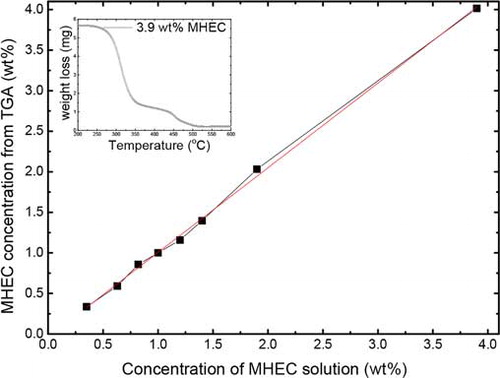
Figure 3. Moisture profiles of the 1 mm bead as a function of position during drying. (a) 0 wt% MHEC profiles plotted every 35 min, (b) 1.3 wt% MHEC, (c) 4.3 wt% MHEC profiles plotted every 68 min, and (d) total volume of water as function of MHEC concentration. The dotted line shows the shift from an inhomogeneous to homogeneous drying.
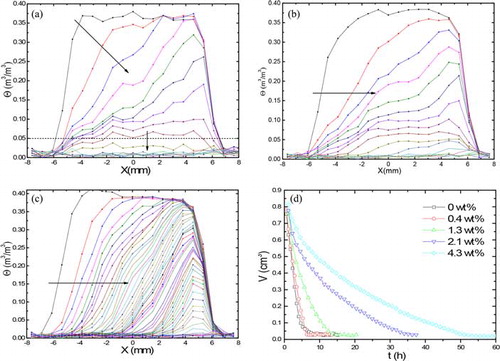
Figure 4. Moisture profiles of the 400–600 µm bead as a function of position during drying. (a) 0 wt% MHEC profiles plotted every 35 min, (b) 1.3 wt% MHEC, (c) 4.3 wt% MHEC profiles plotted every 68 min, and (d) total volume of water as function of MHEC concentration. The dotted line shows the shift from homogeneous to inhomogeneous drying.
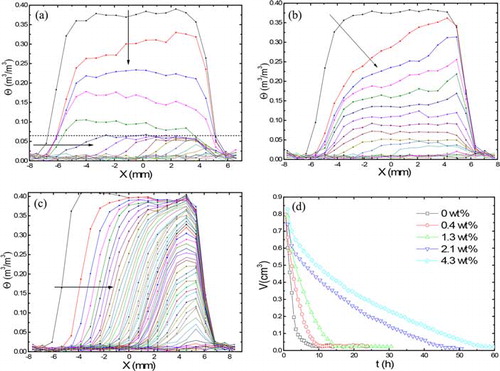
Figure 5. Moisture profiles of the 50 µm bead as a function of position during drying. (a) 0 wt% MHEC profiles plotted every 18 min, (b) 1.3 wt% MHEC profiles plotted every 35 min, (c) 4.3 wt% MHEC profiles plotted every 68 min, and (d) total volume of water as function of MHEC concentration.
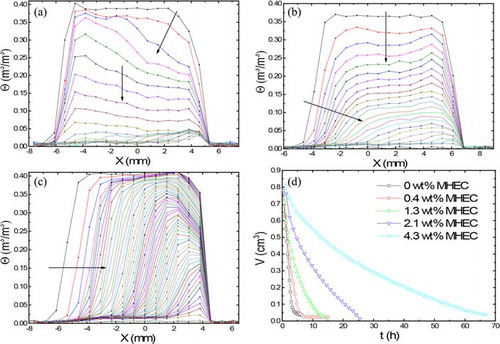
Figure 6. Capillary number vs. bond number as a function of MHEC concentration. The labels h, t, and f represent homogeneous, transition and front receding drying of the corresponding sample, respectively. The numbers 1, 2, 3, 4, 5 represent 0, 0.4, 1.3, 2.1, and 4.3 wt% of MHEC, respectively.
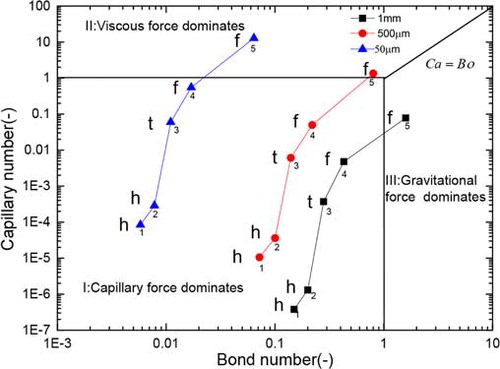
Figure 7. MHEC distribution in mass of MHEC per mass of beads for (a) 1 mm bead, (b) 400–600 µm bead, and (c) 50 µm saturated with different mass weight percentage of the original solution as function of sample position.
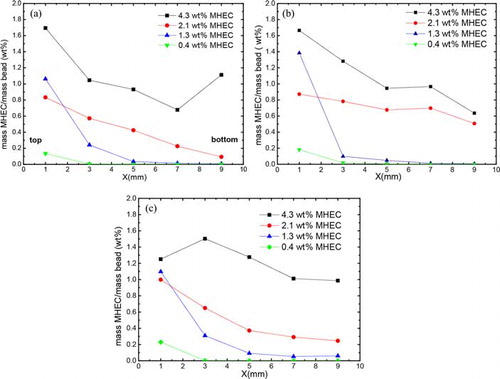
Figure 8. Schematic representation of MHEC concentration inside bead samples before and after drying process.
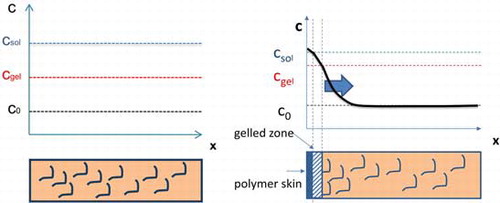
Table 2. Peclet number calculated from the NMR moisture profiles for all bead samples and 0.4 and 1.3 wt% MHEC, respectively.
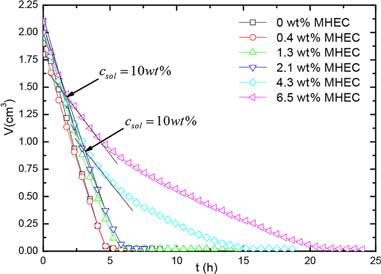
Figure 9. Total volume of water as function of time during bulk evaporation of different weight percentage MHEC solution.