Figures & data
Figure 1. A schematic diagram of the cold DTR. 1: Gas source; 2-1–2-2: stop valve; 3: pressure meter; 4: ball valve; 5: rotameter; 6: gas inlet; 7: flange; 8: drop tube; 9: gas outlet; 10: receiver; 11: data line; and 12: data acquisition system.
Figure 2. Diagram of the hot DTR. 1: Gas source; 2-1–2-4: stop valve; 3.1–3.2: rotameter; 4: flux pump; 5: pressure meter; 6: steam generator; 7.1–7.2: air preheater; 8: flange; 9: air inlet; 10–11: hygrometer; 12: drop tube; 13: blanking buffer; 14: receiver; 15: data line; and 16: temperature controller.
Figure 3. Relationship between falling time vs. Falling height for cut tobacco in cold DTR.
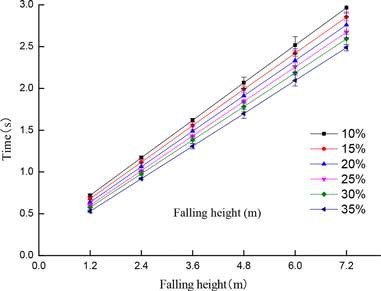
Table 1. Numeric equations obtained from cold DTR experiments.
Figure 4. Falling velocity vs. Moisture content (%) of cut tobacco in the cold DTR.
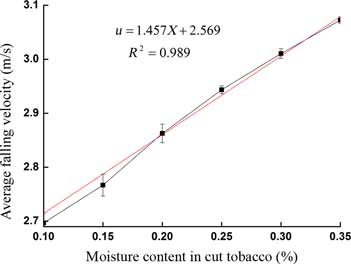
Figure 5. Moisture contents of cut tobacco at different falling heights in hot DTR.
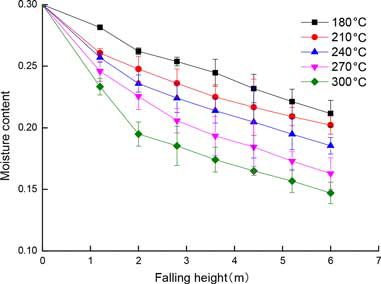
Figure 6. B2F cut tobacco drying curves in (a) absolute dry air and (b) superheated steam.
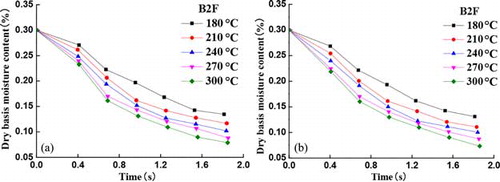
Figure 7. C3F cut tobacco drying curves in (a) absolute dry air and (b) superheated steam.
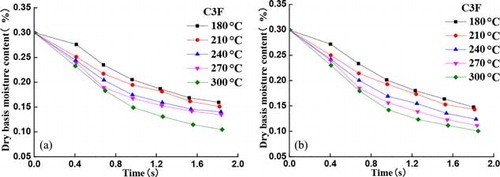
Figure 8. X2F cut tobacco drying curves in (a) absolute dry air and (b) superheated steam.
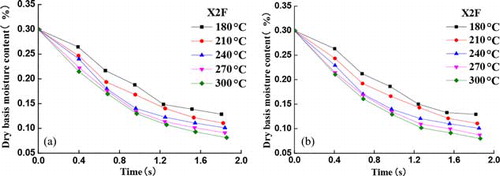
Table 2. Effective moisture diffusivity of cut tobacco with different drying conditions.
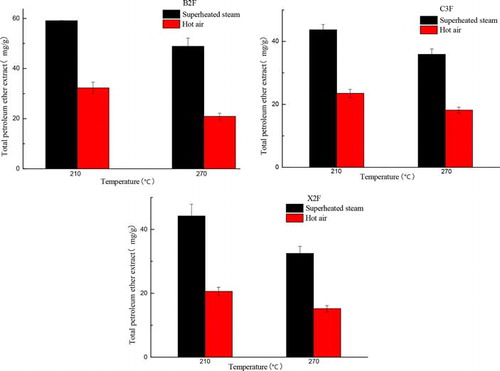
Figure 9. Influence of temperature on total petroleum ether tobacco extract.
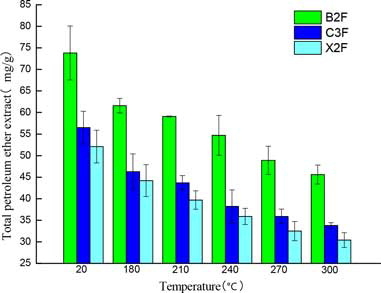
Figure 10. Influence of the drying medium on the tobacco total petroleum ether extract.