Figures & data
Figure 1. Boundary conditions of the internal droplet geometry (left) and external geometry (right), where the droplet area is circumscribed.
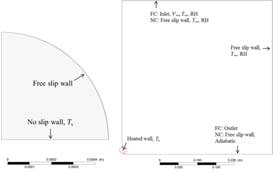
Figure 2. Mesh no. 3 in the close proximity of the droplet.

Table 1. Mesh study.
Figure 3. Temperature and velocity fields both within the droplet and in the surrounding domain. Please note that the computational domain is extended 0.4 m above and beside the droplet, hence part of the domain is not visible in the figure.
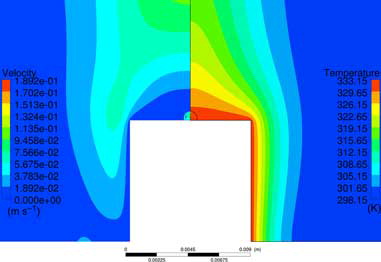
Figure 4. Moisture distribution around the droplet. Please note that the computational domain is extended 0.4 m above and beside the droplet, hence part of the domain is not visible in the figure.
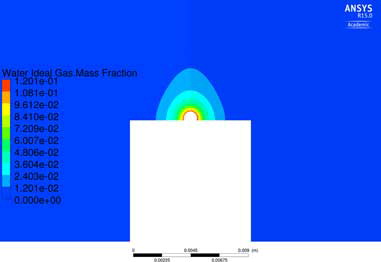
Table 2. Validation of numerical results with different setups.
Table 3. Factors of the DOE together with corresponding results from simulations.
Figure 5. Flow and temperature distribution surrounding the droplet. Left: Run no. 4 presented in (Vin = 0.1 m s−1; Ts = 333.15 K; RH = 80%; ΔT = 5 K, θ = 45°). Right: Run no. 13 presented in (Vin = 0.5 m s−1; Ts = 323.15 K; RH = 100%; ΔT = 2 K, θ = 90°).
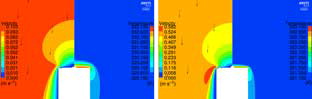
Figure 6. Moisture distribution around the droplet. Left: Run no. 4 presented in (Vin = 0.1 m s−1; Ts = 333.15 K; RH = 80%; ΔT = 5 K, θ = 45°). Right: Run no. 13 presented in (Vin = 0.5 m s−1; Ts = 323.15 K; RH = 100%; ΔT = 2 K, θ = 90°).
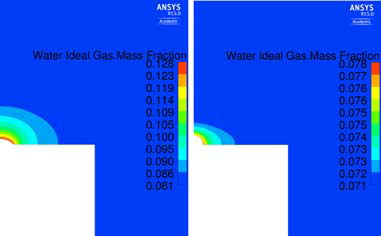
Figure 7. Internal flow in setup 4; Vin = 0.1 m s−1; Ts = 333.15 K; RH = 80%; ΔT = 5 K, θinit = 45°. Conduction, NC, and MC are considered in the internal flow.
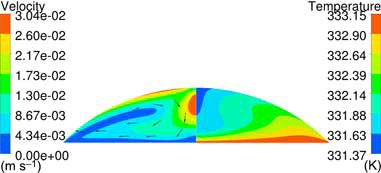
Figure 8. Internal flow in setup 13; Vin = 0.5 m s−1; Ts = 323.15 K; RH = 100%; ΔT = 2 K, θinit = 90°. Conduction and NC are considered in the internal flow.
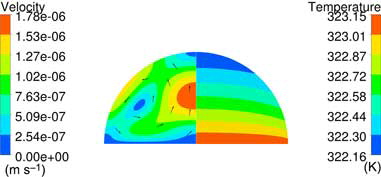
Figure 9. Coefficient plot corresponding to the DOE setup in .
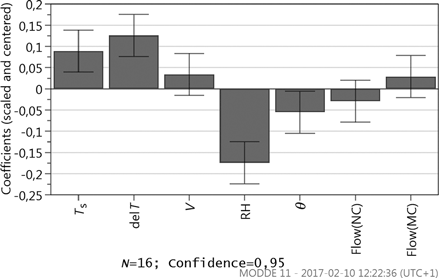
Figure 10. Coefficient plot of a second DOE setup where only significant factors in the surrounding flow are considered. In addition to the factors, also the significance of the interactions is displayed.
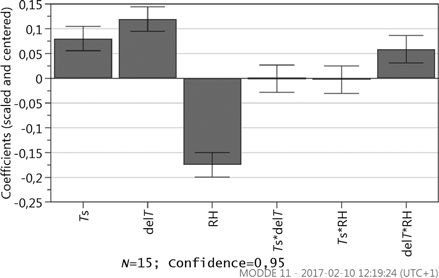
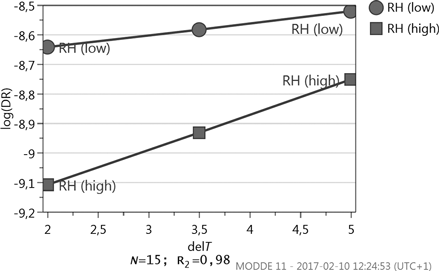
Figure 11. Plot of the interaction between RH and ΔT.