Figures & data
Figure 1. Simplified drum cross section with main dimensions in millimeters.
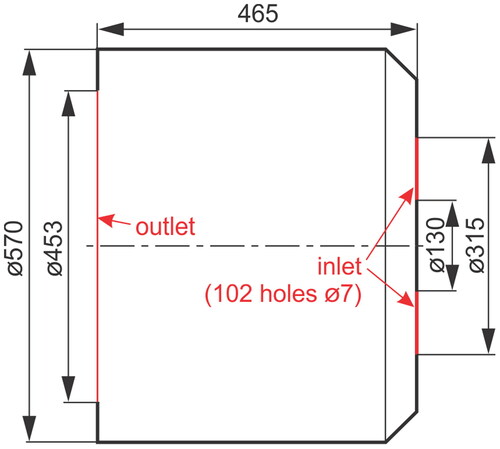
Figure 2. Schematic of the heat pump tumble dryer with locations of sensors.
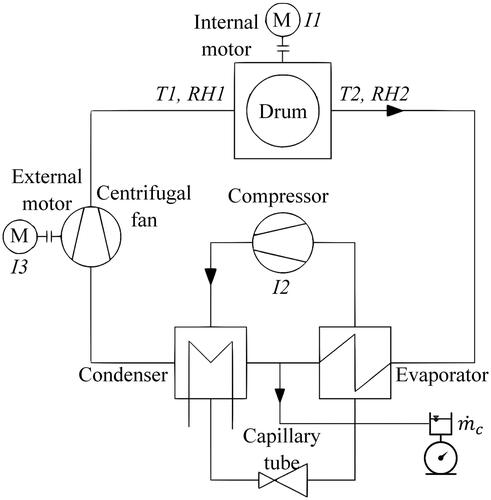
Table 1. Fabric characteristics.
Table 2. Test load composition.
Figure 3. Variability of initial and final moisture content of each fabric item in the test run at 2 kg load and 58 rpm drum speed (T – towels, P – pillowcases, horizontal red line – nominal moisture contents for complete load).
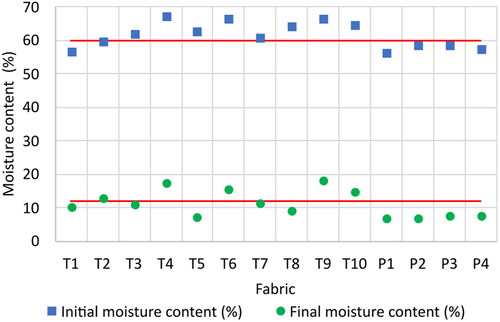
Table 3. Measured operating points.
Figure 4. (a) Energy efficiency and (b) specific drying time as a function of drum speed and load mass.
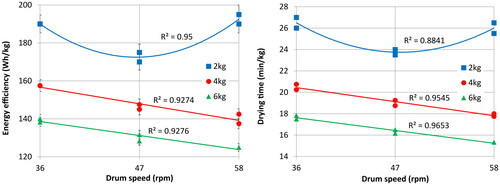
Figure 5. Measured evenness of drying with models, specific to each load mass.
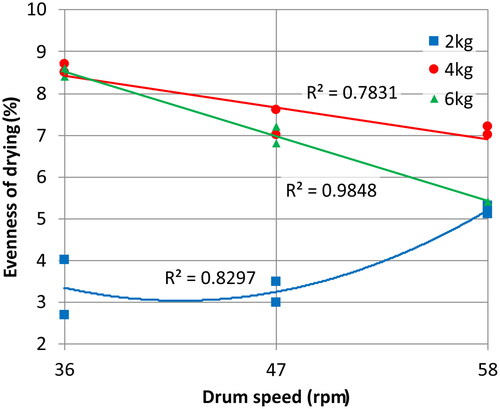
Figure 6. Measured and modeled evenness of drying.
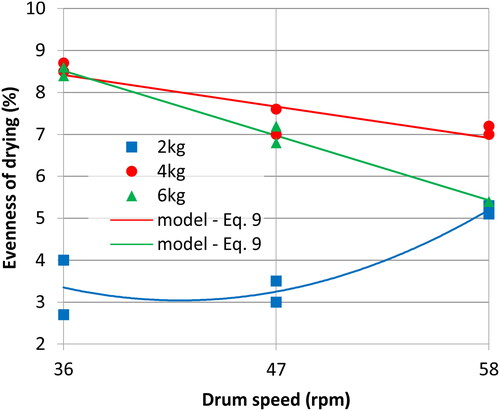
Figure 7. Modeled evenness of drying.
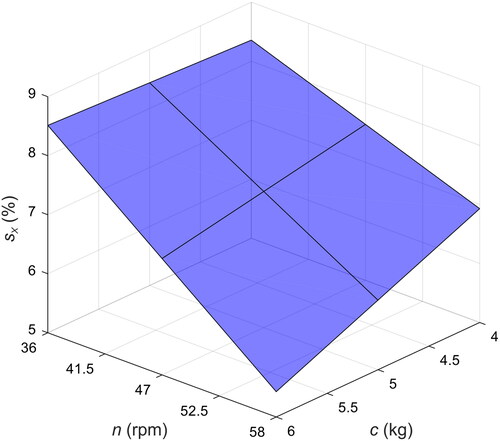
Figure 8. Histograms of deviation of evaporated water share for all operating conditions.
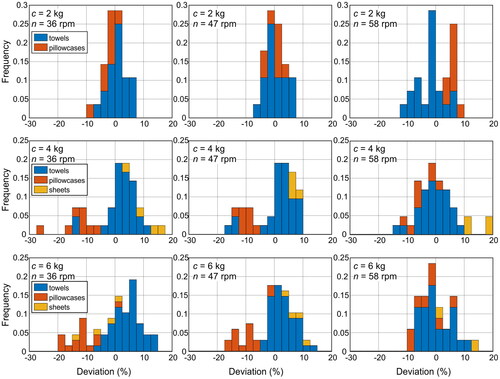
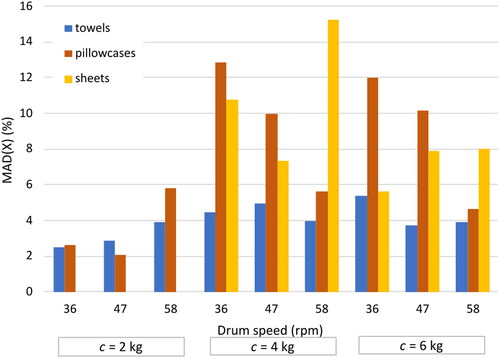
Figure 9. Mean absolute deviation of evaporated water share for different item types.