Figures & data
Figure 1. Scheme of the Particle Droplet Image Analysis test-rig.[Citation53]
![Figure 1. Scheme of the Particle Droplet Image Analysis test-rig.[Citation53]](/cms/asset/059a2208-ccc0-414a-baec-7287857e5eb5/ldrt_a_2004160_f0001_c.jpg)
Table 1. Overview of the conditions for droplet size measurements.
Figure 2. Schematic diagram of the experimental facility (T - temperature indicator; P - pressure indicator).
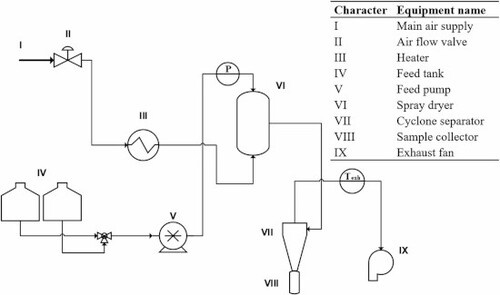
Figure 3. The counter-current spray dryer (a) and its schematic representation (b) (+ signs indicate thermocouple positions).
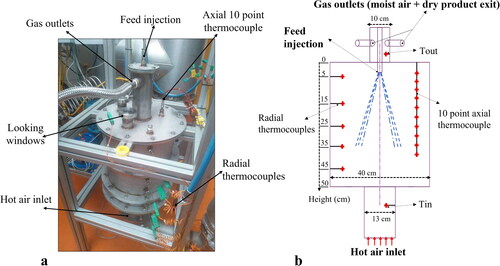
Table 2. Overview of the process conditions for the experimental tests, W-water, SM- skim milk.
Table 3. Droplet size distribution and particle velocities for different nozzle orifices and viscosities at atomization pressure of 30 bar, Vp- Particle average velocity.
Figure 4. SMD as a function of liquid pressure and viscosity for different orifice diameter nozzles.
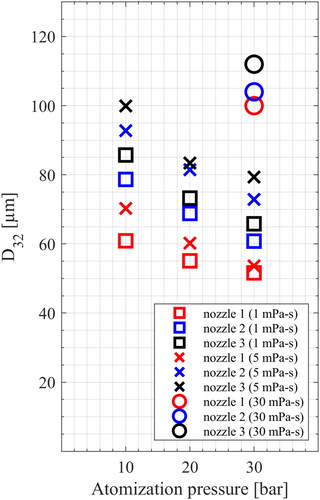
Figure 5. Initial droplet size distribution for the viscosity of 1 mPa.s (a), 5 mPa.s (b), and 30 mPa.s (c) for the different nozzle orifice diameters, at an atomization pressure of 30 bar.
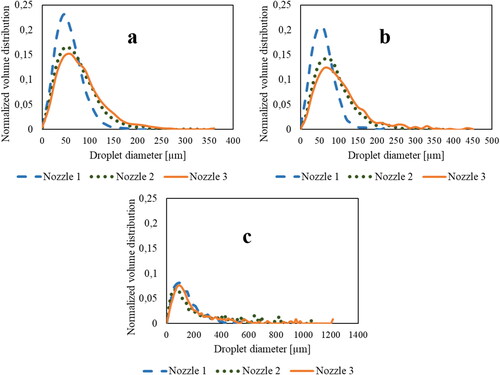
Figure 6. Example droplet images from nozzle 1 for 1 mPa.s (a) 5 mPa.s (b) and 30 mPa.s (c), at an atomization pressure of 30 bar. (Image “a” and “b” are taken at 2 cm while image “c” is taken at 4 cm from the nozzle tip).
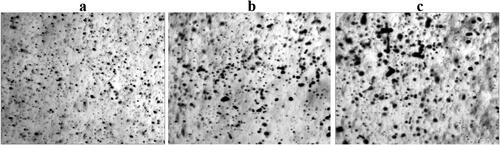
Figure 7. Particle average droplet velocity as a function of liquid pressure and viscosity for different orifice diameter nozzles.
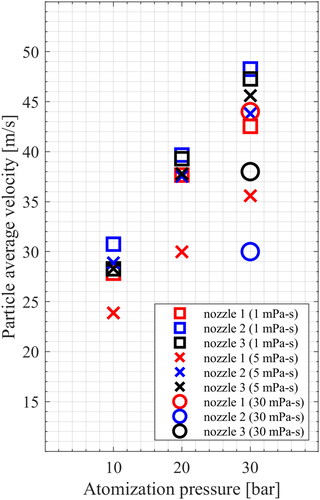
Figure 8. Droplet velocities as a function of droplet diameters (atomization pressure of 30 bar and liquid viscosity of 30 mPa.s for nozzle 1).
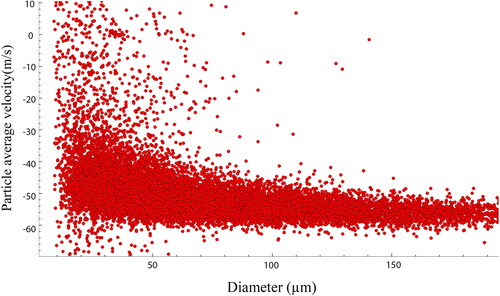
Figure 9. Temperature profiles along the dryer length (0 cm is at the top of the dryer) for radial thermocouples (a) and axial multipoint thermocouple (b), at different air inlet temperature; (air mass flow rate 481 kg/h, feed rate 21 kg/h, droplet SMD 40 µm).
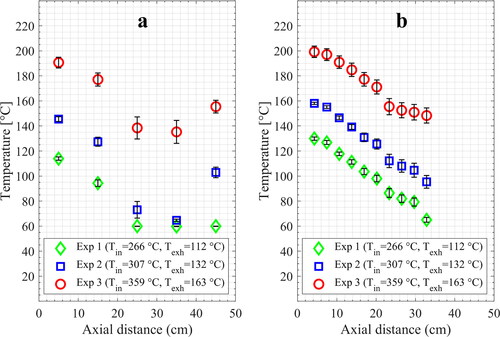
Figure 10. Temperature profiles along the dryer length (0 cm is at the top of the dryer) for radial thermocouples (a) and axial multipoint thermocouple (b), at different air mass flowrate; (air inlet temperature ≈360 °C, feed rate 21 kg/h, droplet SMD 40 µm).
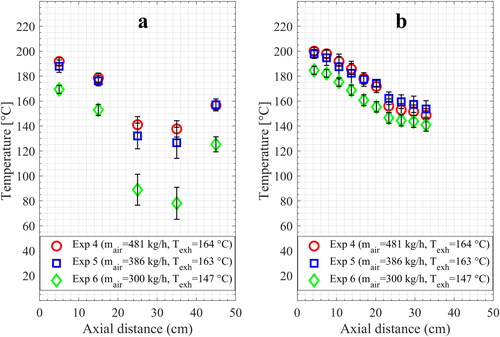
Figure 11. Temperature profiles along the dryer length (0 cm is at the top of the dryer) for radial thermocouples (a) and axial multipoint thermocouple (b) at different spray feed rates and droplet size for nozzle 1; (air inlet temperature ≈360 °C, air mass flow rate 481 kg/h).
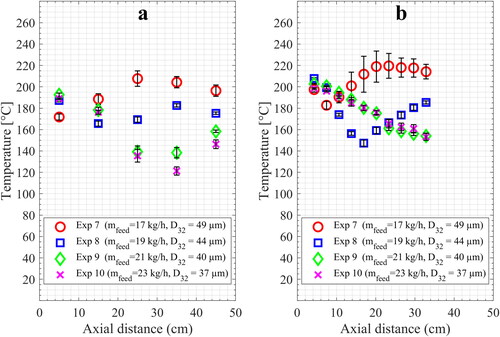
Figure 12. Temperature profiles along the dryer length (0 cm is at the top of the dryer) for radial thermocouples (a) and axial multipoint thermocouple (b) at different spray feed rates and droplet size for nozzle 2; (air inlet temperature ≈360 °C, air mass flow rate 386 kg/h).
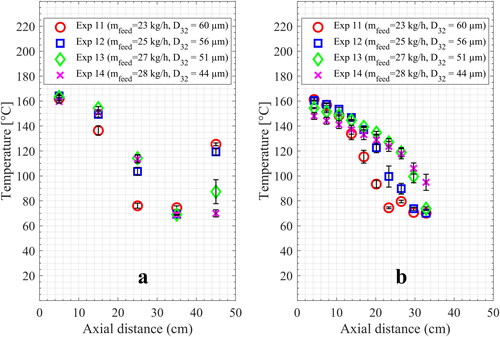
Figure 13. Temperature data for the Experiments: 1, 15, and 16; (air inlet temperature ≈260 °C, air mass flow rate 481 kg/hr, feed rate ≈21 kg/h).
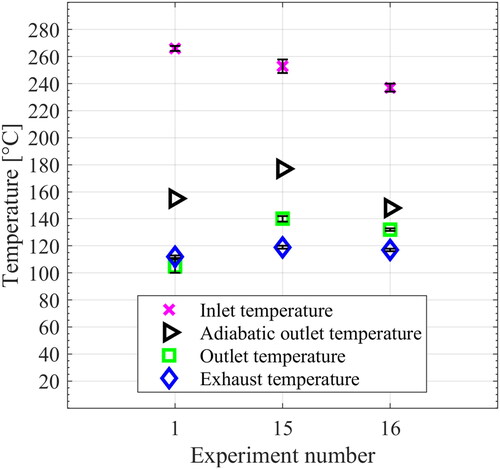
Figure 14. Temperature data for the Experiments: 1, 15, and 16 along the dryer length (0 cm is at the top of the dryer) for radial thermocouples (a) and axial multipoint thermocouple (b); (air inlet temperature ≈260 °C, air mass flow rate 481 kg/hr, feed rate ≈21 kg/h).
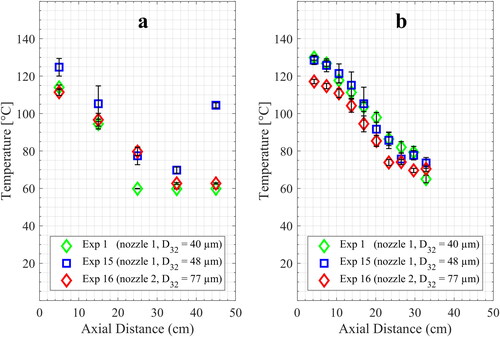
Figure 15. Deposition pattern in the dryer: (top) results for nozzle 1, (bottom) results for nozzle 2, (left) top-down view from the inside of the dryer, (middle) zoom of the top section with thermocouples, (right) top wall of the dryer with visible viewpoints and exhaust chimney.
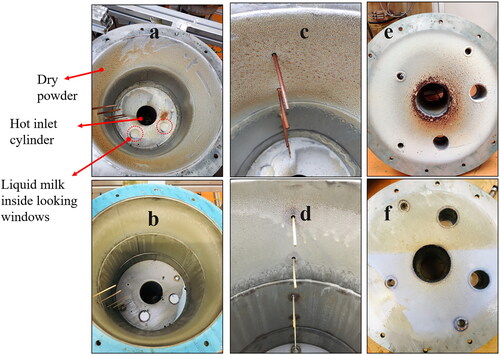
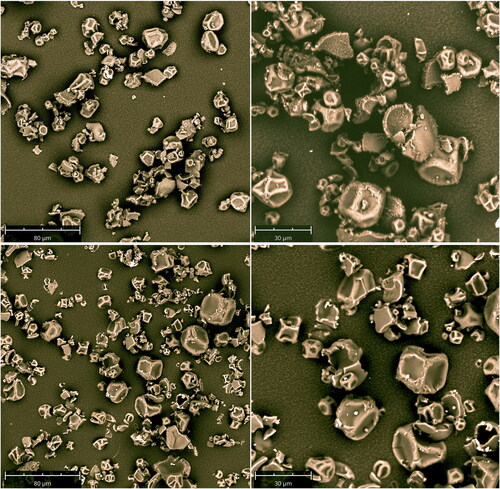
Table 4. Powder particle size distribution and moisture content.
Figure 16. SEM images of recovered powder samples at different magnifications, top row: nozzle 1, bottom row: nozzle 2.