Figures & data
Figure 1. (A) Oligonucleotide sequences with the reporting 2AP base, used in the experiments. a, 2-aminopurine (2AP); the triplex-forming oligonucleotides: Z1 contains 2AP in the third R-strand; Z2 contains 2AP in the W-strand. The hairpin-forming oligonucleotide, Z3, represents the duplex part of the triplex Z2. CW represents a 12-bp hairpin with the mixed base sequence. (B) Schemes of the base triplets 2AP*(T:A), A*(T:A), and G*(C:G).
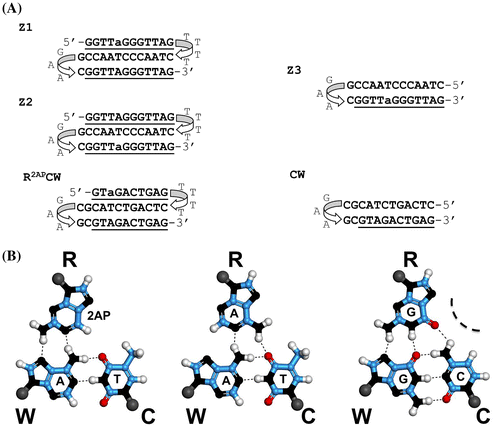
Figure 2. Reciprocal fluorescence anisotropy of EtBr bound to oligonucleotides at different temperatures: Z1 in .5 M LiCl (open triangles), Z2 in .5 M NaCl (filled triangles), Z3 in .5 M LiCl (open circles), and CW in .5 M LiCl (filled circles). Y axis: reciprocal anisotropy 1/r, X axis: ratio of the absolute temperature to viscosity of solution. Value of T/η = 3 corresponds to 24°C (see Methods). Samples contained 1 μM oligonucleotides, 1 μM EtBr,10 mM Tris–HCl buffer, pH 7.6.
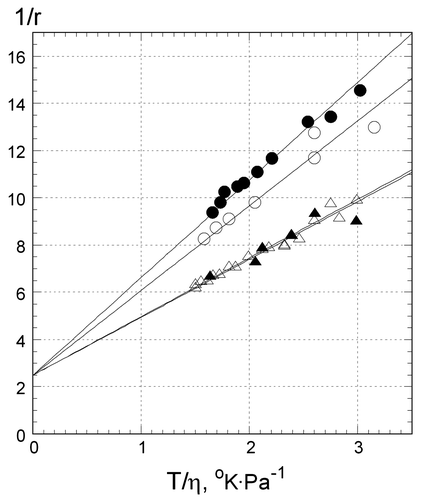
Figure 3. Temperature dependence of the fluorescence emission of 2AP, incorporated in the oligonucleotides in .5 M LiCl (A) and .5 M NaCl (B): Z1 (filled circles), Z2 (open circles), and Z3 (triangles). Every 20th experimental point is marked. The excitation wavelength was 310 nm, emission was measured at 370 nm. Samples contained 1 μM oligonucleotides, 10 mM Tris–HCl buffer, pH 7.6.
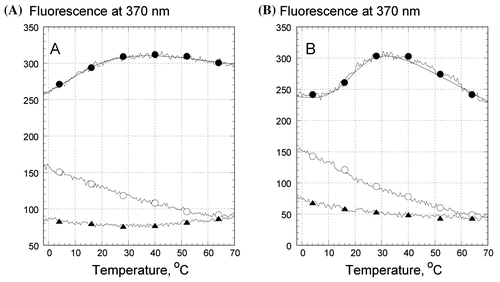
Table 1. Thermodynamic parameters of 2AP*T: a triplet formation.
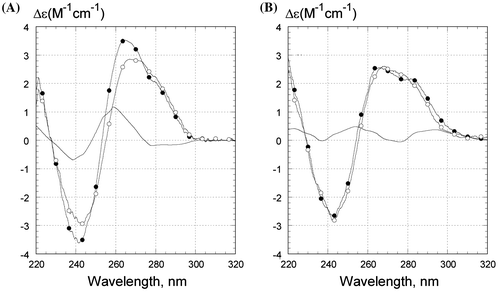
Figure 4. CD spectra of Z1 oligonucleotide in (A) .5 M LiCl and in (B) .5 M NaCl. Temperature was 0°C (filled circles) or 50°C (open circles). The unmarked curves are the difference between CD spectra at 0°C and at 50°C. Samples contained 1 μM oligonucleotides, 10 mM Tris–HCl buffer, pH 7.6. CD is presented as molar CD per nucleotide.