Figures & data
Figure 1. Metal binding modes used in this study. Top row, left-right: Fe_1, Fe_2 and Fe_3. Bottom row, left-right: Cu and Zn.
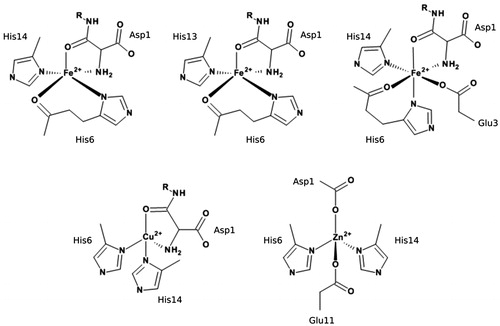
Figure 2. Backbone RMSD values (Å) for the simulations of Fe_1, Fe_2 and Fe_3.
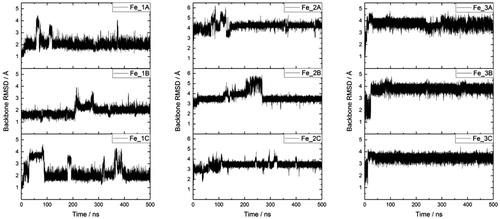
Table 1. Total percentage of secondary structure, by type, for Fe(II)–Aβ complexes.
Figure 3. RMSF data (Å) for three different Fe coordination modes.
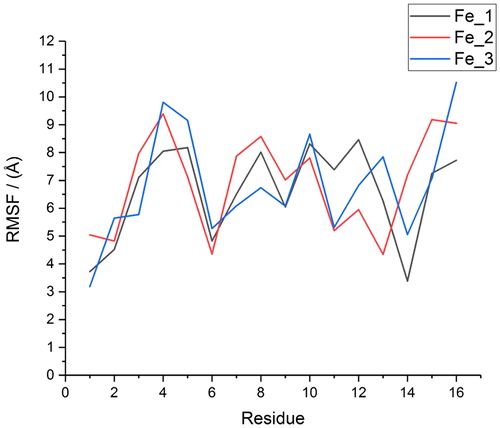
Table 2. Percentage of secondary structure types observed over equilibrated trajectories.
Table 3. Statistics of hydrogen bond occupation.
Figure 4. Secondary structure plots, Ramachandran and residue contact maps for Fe(II)–Aβ complexes.
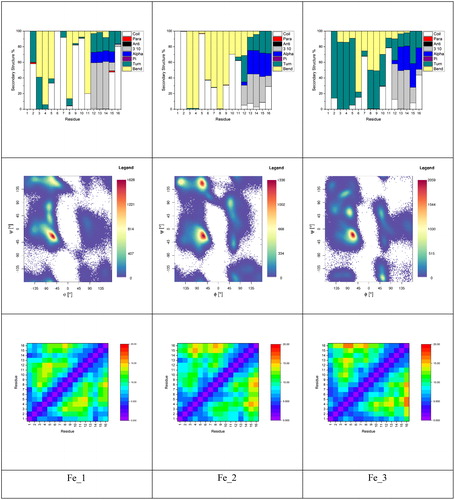
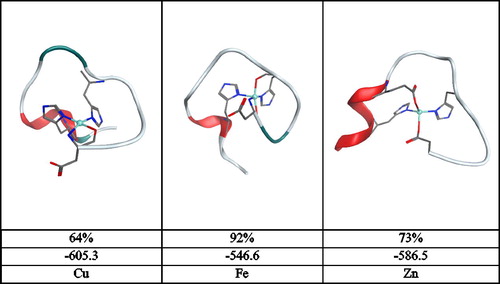
Figure 5. Minimised geometry and clustering percentage of three Fe(II) complexes.
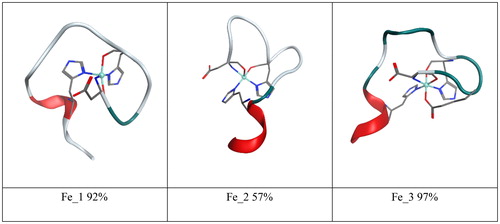
Figure 6. Backbone RMSD values (Å) for the simulations of Cu, Fe_1 and Zn.
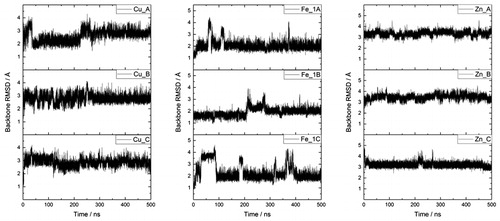
Table 4. Summary of bond critical point propertiesTable Footnotea for metal–ligand bonds (au).
Figure 7. RMSF values (Å) for Cu, Fe_1 and Zn structures.
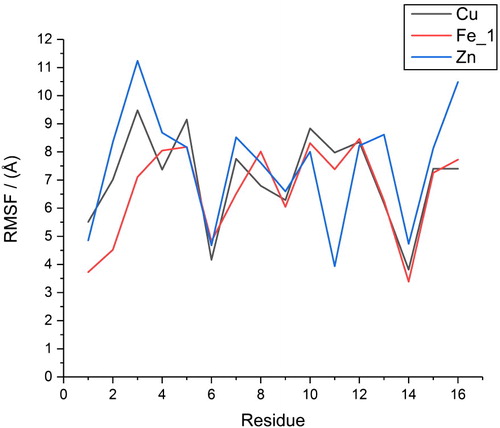
Figure 8. Breakdown of secondary structure and Ramachandran maps for Cu, Fe_1 and Zn complexes with Aβ1–16.
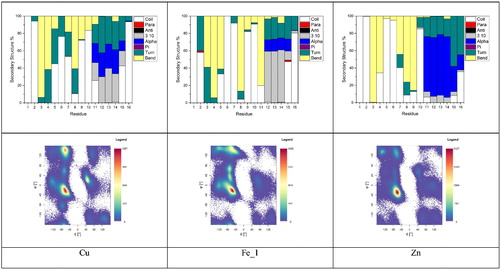
Figure 9. Occupancy of salt bridges and contact maps for Cu, Fe_1 and Zn complexes.
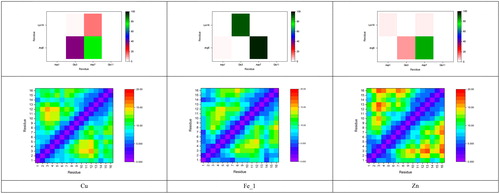
Figure 10. Plots of hydrogen bond occupancy for Cu (left), Fe_1 (centre) and Zn (right). Plots only display data for hydrogen bonds present for greater than 5% of simulation. Black circles indicate multiple interactions between relevant residues.
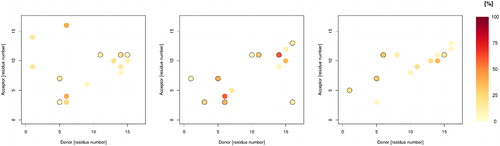
Figure 11. Summary of clustering analysis: minimised geometry, percentage occupancy and molecular mechanics energy (kcal/mol) after minimisation.