Figures & data
Figure 1. Surface topography (height), and IR absorption pattern (deflection) of the lysozyme fibrils/oligomers. (a) Height and (b) deflection on day 21. (c) Height and (d) deflection on day 1. Data contributing to the IR-absorption map were acquired at a wavenumber of 1650 cm−1. The lysozyme sample was prepared in distilled water adjusted to pH 2 with HCl. The protein samples with the final protein concentration of 1 mM, were deposited on a cover slip glass surface and the samples were left in a nitrogen gas chamber to dry before nanoIR measurements.
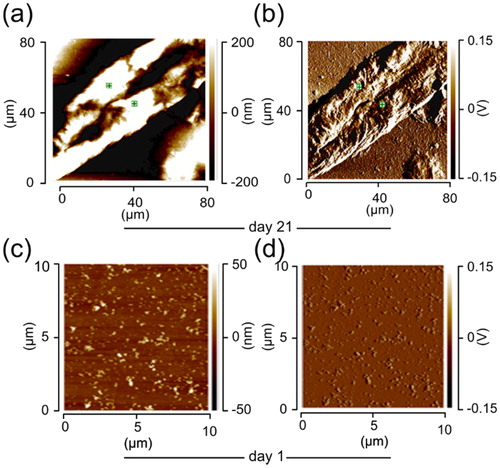
Figure 2. Stiffness and Young’s modulus of lysozyme fibrils. The day 1 lysozyme was shown in red color, having the lowest stiffness as well as Young’s modulus. The days 3, 10 and 21 were shown in maroon, blue and yellow color, respectively.
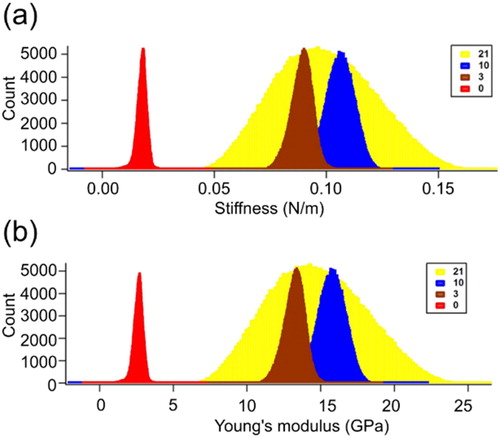
Figure 3. nanoIR absorption spectra acquired at two different days. The amide I, II and III regions of the spectra were highlighted, which were used to derive the secondary structure content of the lysozyme at day 21 and day 1. (a) and (b) represent the various number of the spectra taken of the lysozyme sample. (c) and (d) represent averaged spectra of (a) and (b).
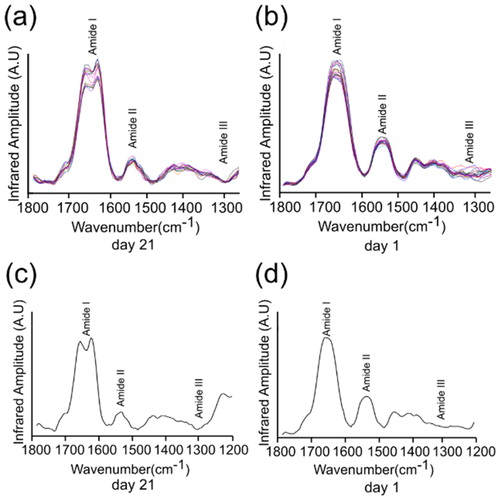
Figure 4. The second derivative absorption spectra acquired at two different days, day 21 and day 1. (a) The day 21 spectra taken from wavenumber 1800 to 1200 cm−1. (b) The day 1 spectra taken from wavenumber 1800 to 1200 cm−1. (c) Averaged spectra of (a) and (b) representing wavenumber from 1800 to 1500 cm−1. (d) Averaged spectra of (a) and (b) representing wavenumber from 1500 to 1200 cm−1.
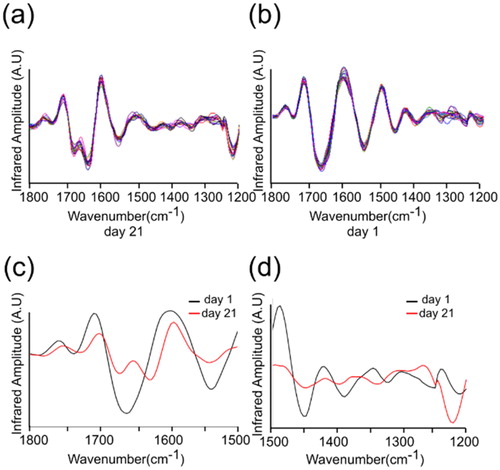
Figure 5. Secondary structural dynamics and morphological features. (a) Far-UV CD spectra of lysozyme at various day intervals. The spectra were measured using a Chirascan CD spectrometer at 25 °C. The concentration of lysozyme was 10 μM and the cell path lengths were of 1 mm were used for far-UV (from 190 to 250 nm) data acquisition. Three scans were averaged to obtain each spectrum and final spectra of lysozyme was obtained by subtracting it from buffer spectra. (b) The TEM images of lysozyme amyloid fibrils. Electron micrograph showing the morphological features of a negatively stained preparation of 10 μM lysozyme incubated at 65 °C for various days. Amyloid fibrils of lysozyme have linear and unbranched structural morphology.
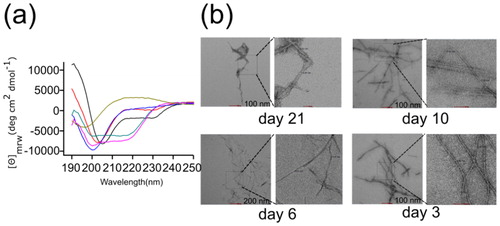
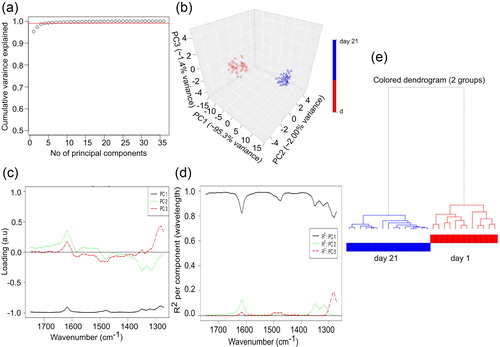
Figure 6. Chemometric and hierarchial analysis of IR spectra. (a) Variance plot of the IR spectra of lysozyme showing the amount of variance captured by each principal component. (b) PCA score plot. (c) Loading plot for the IR spectra ensemble of lysozyme fibrillation. (d) Cumulative proportion plot for the IR spectra ensemble of lysozyme fibrillation. (e) Hierarchical clustering of the spectra for the two different lysozyme fibrils type.