
Figures & data
Table 1. Details of the seven cytosolic GST isoforms.
Figure 1. Study’s schematic workflow. Tool and database explanations and abbreviations are given in the main text.
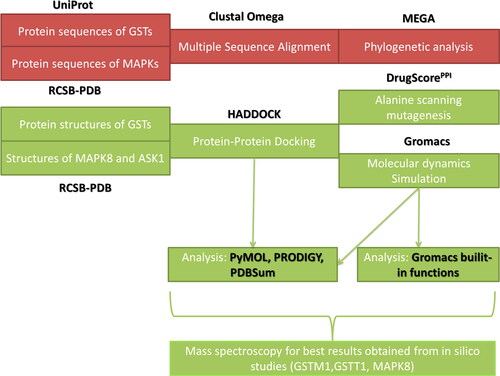
Figure 2. Phylogenetic analysis of seven human glutathione S-transferase isoforms using four different methods: (a) Unweighted pair-group mean average (UPGMA), (b) Neighbour-joining (NJ), (c) Minimum evolution (ME) and (d) Maximum parsimony (MP). Each isoform’s UniProt accession number is also shown.
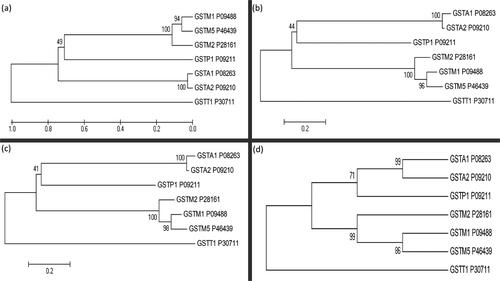
Figure 3. MD simulation results for GST-M1 with MAPK8: (a) Root Mean Square Deviation (RMSD), (b) Radius of Gyration (RoG), (c) Potential Energy and (d) Principal Component Analysis (PCA). (X-axis: time in graphs (a), (b) and (c). Y-axis: values for (a) RMSD, (b) RoG and (c) Potential energy. For graph (d), X-axis: principal component 1 and Y-axis: principal component 2.
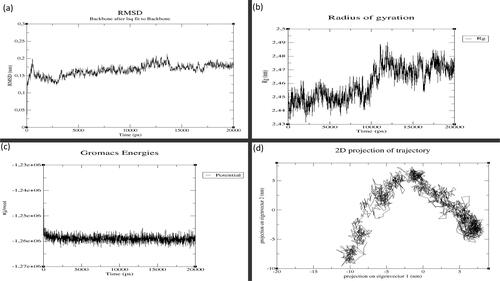
Table 2. Docking score, estimated free energy of binding (ΔG) and estimated binding affinity (Kd) of GSTs with the MAPK8 and ASK1 complexes, obtained from the HADDOCK and PRODIGY web servers.
Table 3. Analysis of the intermolecular interactions of the protein–protein complexes formed by the seven GST isoforms with MAPK8 protein and with ASK1.
Table 4. Time-averaged structural properties obtained from the MD simulations of seven GST isoforms with MAPK8 and with ASK1 protein.
Figure 4. MD simulation results for GST-T1 with ASK1, (a) RMSD, (b) Radius of Gyration, (c) Potential Energy and (d) Principal Component Analysis (X-axis: time in (a), (b) and (c). Y-axis: values for graphs (a) RMSD, (b) RoG and (c) Potential energy. For graph (d), X-axis: principal component 1 and Y-axis: principal component 2.
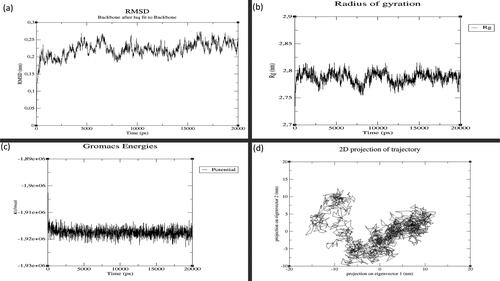
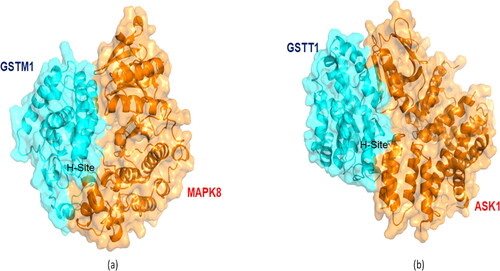
Figure 5. Predicted protein–protein complex obtained from HADDOCK’s easy interface. (a) GST-M1–MAPK8 complex and (b) GST-T1–ASK1 complex. Hydrophobic sites of GSTs interact with MAPK8’s kinase domain and with ASK1.
Supplementary_information_final__clean.doc
Download MS Word (6.3 MB)Data availability statement
The raw data files and docking complexes, MD simulation files and corresponding meta-data are available at: https://zenodo.org with doi: 10.5281/zenodo.3921901.