
Figures & data
Figure 1. The Radar map of amino acid sequence alignment results of hepatitis B virus subtype A, B, and C.
A. The relative mutability of mutated residues in C and S regions of HBV virus based on 20-letter alphabet amino acids.
B. The relative mutability of mutated residues in the C and S regions of HBV viruses based on the definition of 6 groups, which can divide amino acids into following 6 groups: hydrophobicity (V, I, L, M, W, Y, C), polarity (N, Q, S), positive charge (R, K, H), negative charge (D, E), conformation (G, P), and AT area.
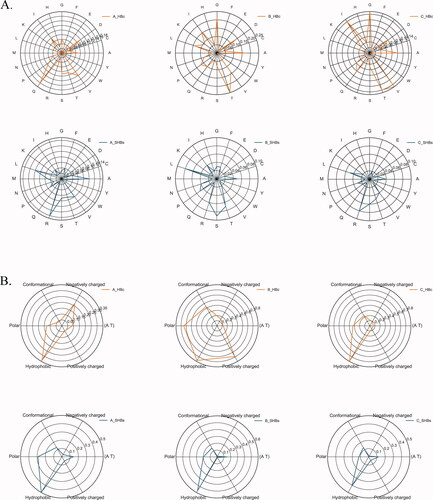
Table 1. The mutation sites in the conserved region.
Table 2. 37 mutation sites selected based on hydrophobicity.
Table 3. Mutation sites selected based on antigen peptide prediction score (Cutoff is rank%<2) The one that labeled red is an antigenic peptide that has appeared in the hepitopes database, the rank% threshold for strong binding peptides is 0.500, and the weak one is 2.000.
Figure 2. Prediction of transmembrane regions of S region.
This picture shows the predicted map of transmembrane region. The abscissa is the position of the amino acid residue, and the ordinate is the prediction possibility. The black line indicates that the position may be in the intracellular segment; the red line denotes the outside region; and the vertical line on the X axis represents the prediction of transmembrane region.
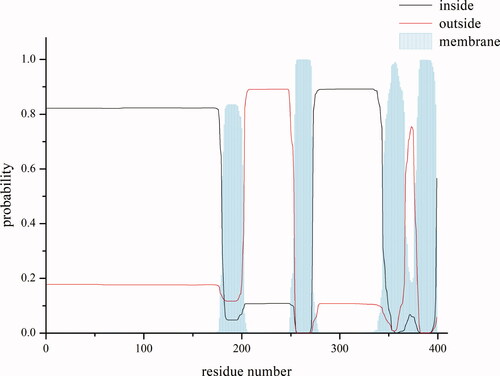
Figure 3. Binding models of peptide FLLTRILTI and MHC I molecular proteins.
MHC and peptide are separately colored in gray and magenta, key residues are shown in stick model. Hydrogen bonds are shown in yellow dash lines.
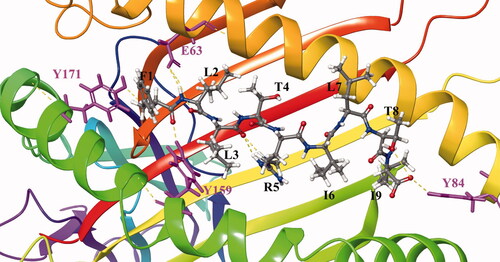
Figure 4. Residue Scanning Computation of 21 mutation sites.
A. Results of residue scanning are shown on the genome. The inner circle displays the HBV viral genome structure and its encoded protein. The first outer ring (green) indicates the change in affinity produced by the corresponding site mutation, and the outermost layer (blue) indicates the resulting change in stability. The degree of change is expressed in terms of the height of the column, where the negative result is marked in red.
B. Comparison of results. The left and right images represent mutations that occur in subtype A and B/C, respectively. The ordinate indicates the mutation site. The horizontal axis represents ΔΔGstability (kcal/mol) and ΔΔGaffinity (kcal/mol), marked with blue and red. The threshold is set at +3kcal/mol (yellow line). Positive values indicate that the mutation has a negative impact on affinity and stability.
Figure 5. RMSD of docking structure produced by mutant L389V.
A stable period (20ns∼100ns, 30 ∼ 60ns) demonstrates a stable structure. The arrow points the structure that we selected to run MM/GBSA calculation. The MM/GBSA values of the wild type (L389) and mutant type (L389V) were -69.48kcal/mol and -61.73kcal/mol, respectively.
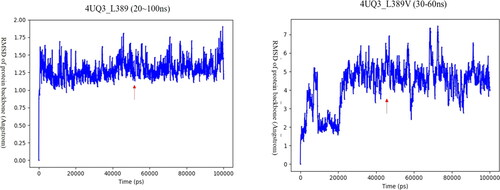
Figure 6. MM/GBSA calculation results of mutation sites.
The x-axis represents the mutation sites and the ordinate is the values (kcal/mol) of MM/GBSA. The red and blue columns represent the MM/GBSA values of the wild-type and the mutant-type, respectively.
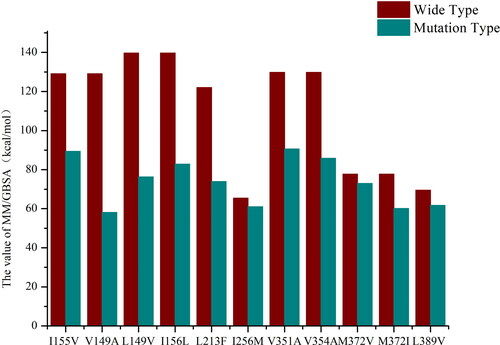
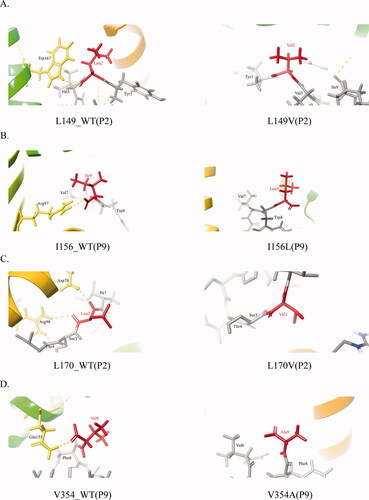
Figure 7. Non-covalent pattern between peptide and HLA.
The picture shows the covalent bond between the antigenic peptide and HLA. MHC and peptide are separately colored in yellow and gray. The mutant amino acids are in red, the yellow dotted line is the hydrogen bond.
A-D. Non-covalent bond pattern between HLA and residue of P2or P9position of peptide antigen that corresponding to L149V, I156L, L170V, and V354A before and after mutation.
Sfigure.pdf
Download PDF (1.2 MB)Availability of data and materials
All sequences involved in this manuscript are available in HBVdb database (https://hbvdb.ibcp.fr/) and AFND (http://www.allelefrequencies.net/). Structure information could acquire from RCSB PDB (https://www.rcsb.org/).