Figures & data
Figure 1. Two-dimensional structures of the 21 phytochemicals of Centella asiatica considered in this study. Also shown are the structures of canagliflozin, dapagliflozin, and empagliflozin – the known SGLT-2 inhibitors.
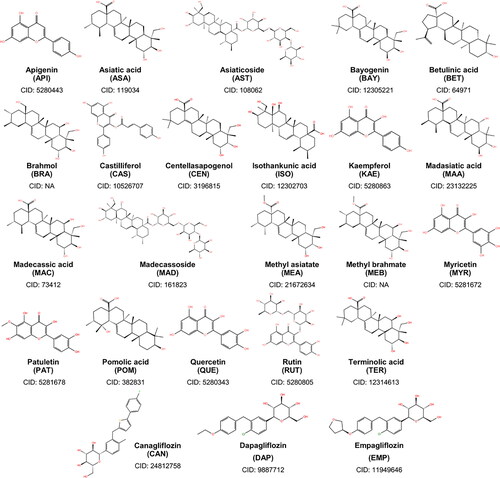
Table 1. ADMET and drug-likeness results of the ligands and the references.
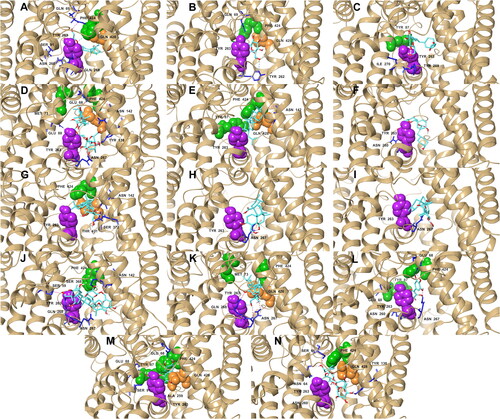
Figure 2. Reside interactions within 4.0 Å of the top eleven ligands and references with the SGLT-2 protein. References: (A) CAN, (B) DAP, (C) EMP. Candidate ligands: (D) AST, (E) BET, (F) CAS, (G) CEN, (H) ISO, (I) MAA, (J) MAD, (K) MEB, (L) MYR, (M) QUE, (N) RUT. Majority of the interactions were hydrophobic and polar while only a few electrostatic contacts were observed. Three residues (Glu 68, Ile 427, and Tyr 263) were also observed to have interacted with all the candidate ligands and the references.
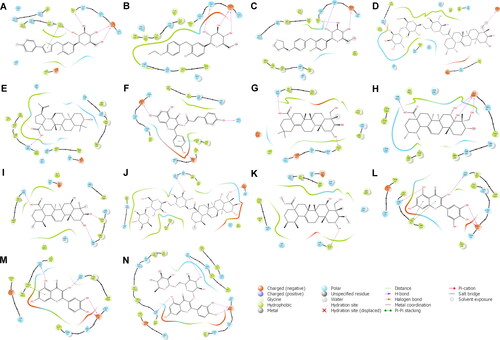
Figure 3. Docking poses of the top five ligands and the references inside the binding pocket of SGLT-2. Also shown are the some of the interacting residues and their corresponding interaction types: hydrogen bonds (pink); aromatic hydrogen bonds (blue); pi-pi stacking (black). References: (A) CAN, (B) DAP, (C) EMP. Candidate ligands: (D) AST, (E) BET, (F) CAS, (G) CEN, (H) ISO, (I) MAA, (J) MAD, (K) MEB, (L) MYR, (M) QUE, (N) RUT. Extracellular (Phe 424, Tyr 87, Met 73) and intracellular (Tyr 263) gate residues are represented with green and purple spheres, respectively. Gln 428, the residue with the most critical role in the absorption mechanism, is represented with orange spheres.
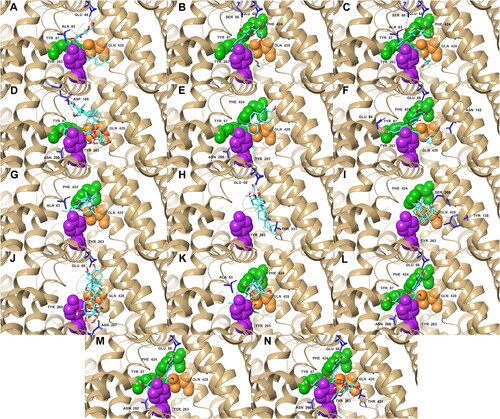
Table 2. Average docking and MM-PBSA scores of the 21 phytochemicals from the three trials.
Table 3. Common interacting residues among the ligands with the highest docking scores and the references within 4.0 Å.
Table 4. H-bond interactions of the top candidate ligands.
Figure 4. Complex-RMSD of the top five ligands and the three references docked against the binding site of SGLT-2. References: (A) CAN, (B) DAP, (C) EMP. Candidate ligands: (D) AST, (E) BET, (F) CAS, (G) CEN, (H) ISO, (I) MAA, (J) MAD, (K) MEB, (L) MYR, (M) QUE, (N) RUT.
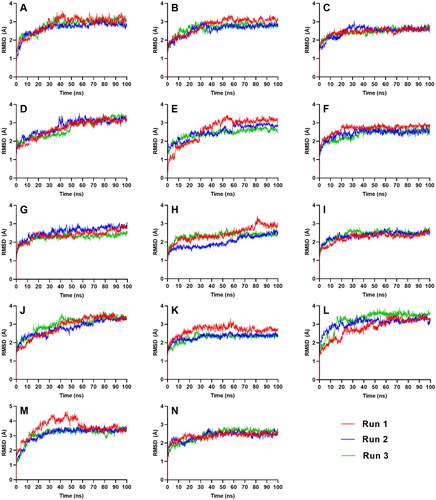
Figure 5. Ligand-RMSD of the top five ligands and the three references docked against the binding site of SGLT-2. References: (A) CAN, (B) DAP, (C) EMP. Candidate ligands: (D) AST, (E) BET, (F) CAS, (G) CEN, (H) ISO, (I) MAA, (J) MAD, (K) MEB, (L) MYR, (M) QUE, (N) RUT.
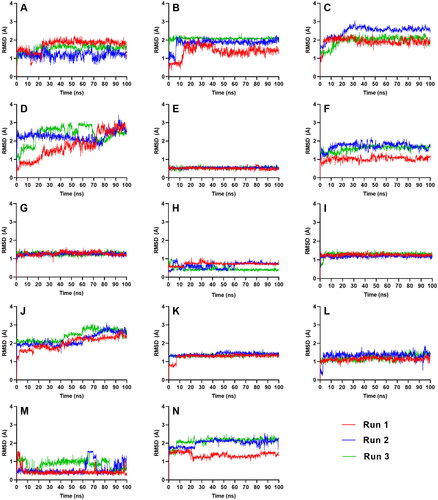
Table 5. Complex-RMSD and Ligand-RMSD of the top eleven promising compounds.
Figure 6. Average number of intermolecular hydrogen bond interactions from the three runs throughout the entire simulation. References: (A) CAN, (B) DAP, (C) EMP. Candidate ligands: (D) AST, (E) BET, (F) CAS, (G) CEN, (H) ISO, (I) MAA, (J) MAD, (K) MEB, (L) MYR, (M) QUE, (N) RUT.
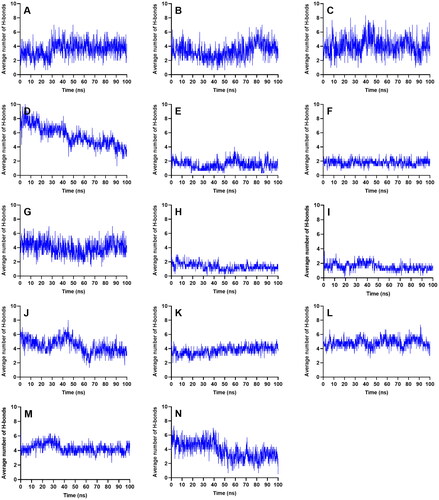
Figure 7. RMSF plot of the top five ligands and the three references docked against the binding site of SGLT-2. References: (A) CAN, (B) DAP, (C) EMP. Candidate ligands: (D) AST, (E) BET, (F) CAS, (G) CEN, (H) ISO, (I) MAA, (J) MAD, (K) MEB, (L) MYR, (M) QUE, (N) RUT. The brown bars in the x axis represent the location of critical residues including Gln 428, and the gate residues, Met 73, Tyr 263, Phe 424, and Tyr 87.
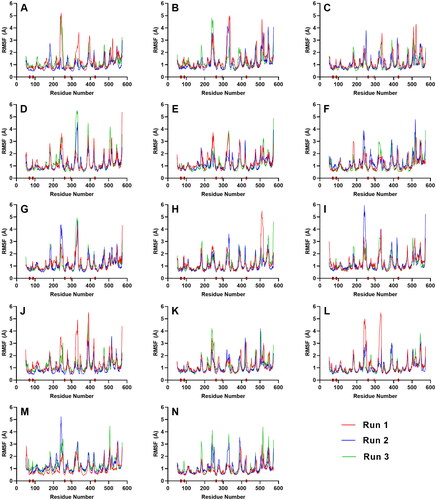
Table 6. Average binding free energies of the top ligands.
Figure 8. Decomposition of the binding free energy on a per residue basis of the complexes with the strongest MM/PBSA energies. References: (A) CAN, (B) DAP, (C) EMP. Final candidate ligands: (D) AST, (E) BET, (F) CEN, (G) MEB, (H) RUT.
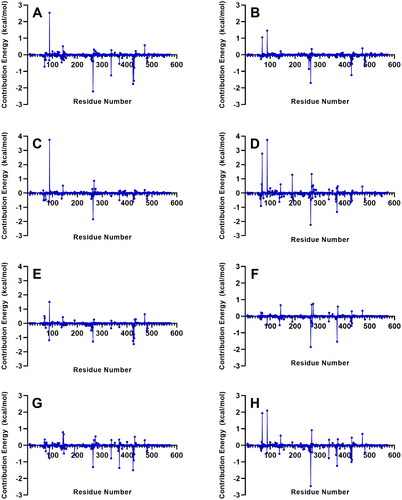
Figure 9. Residues with the highest energy contribution from the complexes with the strongest MM/PBSA energies. Also shown is the decomposition of the binding free energy on a per-residue basis into contributions from the molecular mechanics (van der Waals + electrostatic) energy, polar solvation energy, and non-polar solvation energy. References: (A) CAN, (B) DAP, (C) EMP. Final candidate ligands: (D) AST, (E) BET, (F) CEN, (G) MEB, (H) RUT.
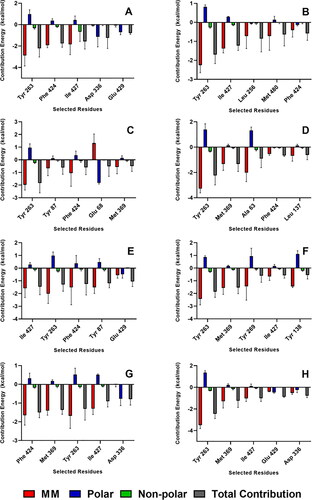
Figure 10. Representative structures of the most populated cluster of conformations that are within 2.0 Å RMS of each other in the last 10 ns of the trajectory: hydrogen bonds (pink); aromatic hydrogen bonds (blue); pi-pi stacking (black). References: (A) CAN, (B) DAP, (C) EMP. Candidate ligands: (D) AST, (E) BET, (F) CAS, (G) CEN, (H) ISO, (I) MAA, (J) MAD, (K) MEB, (L) MYR, (M) QUE, (N) RUT. Extracellular (Phe 424, Tyr 87, Met 73) and intracellular (Tyr 263) gate residues are represented with green and purple spheres, respectively. Gln 428, the residue with the most critical role in the absorption mechanism, is represented with orange spheres.