Figures & data
Figure 1. Isolation of fungi from the decaying seeds of C. mannii and qualitative lipase activity assay. (A) impure culture and (B) pure culture of putative Aspergillus flavus. Qualitative Screening of Aspergillus flavus for lipolytic activity on phenol red agar plate incorporated with olive oil (C) After 24 hr (D) After 72 hr of growth. The yellow halo around the colony indicates lipase activity.
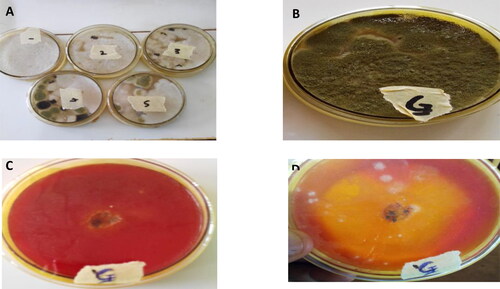
Table 1. Predicted O-glycosylation positions.
Figure 2. Phylogenetic trees of AFL nucleotide (A) is the Neighbour Joining tree for AFL-Lipase nucleotide. (B) is the Fast-minimum evolution tree for AFL-Lipase nucleotide obtained from NCBI. (C) is the neighbour-joining tree for the AFL-lipase amino acid sequence. (D) is the fast-minimum evolution tree for AFL-lipase amino acid sequence. The query sequence for the putative Aspergillus flavus sequence isolated in this work clustered with other Aspergillus flavus and are highlighted in yellow. The type material (ancestor) is highlighted in grey. Scale 0.01 represents the maximum sequence difference.
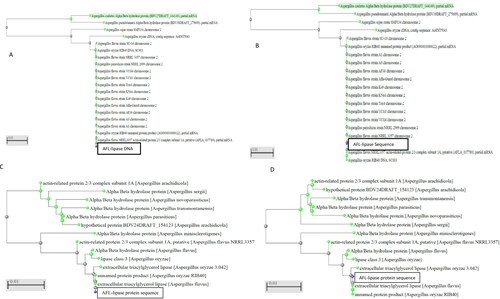
Figure 3. Multiple alignments of AFL-Lipase protein sequence with other fungi triacylglycerol lipases. Highly conserved regions are stared (*) Conserved amino acids at the catalytic site are indicated by a red box and the catalytic triad (G-X-S-X-G) is indicated with small triangles. The predicted active site lid is indicated by a black box. The dashed line represents gaps in the sequence. In the above alignment, AFL-lipase (TPW): Amino acid sequence from AFL-lipase being studied in this work; XP_001819264, Amino acid for extracellular Lipase from Aspergillus oryzae; RAQ_47979.1, Amino acid for Extracellular lipase from Aspergillus flavus; EIT-72839.1, Amino acid for lipase from Aspergillus oryzae; CDM-34977.1, Amino acid sequence coding for lipase from Penicillium roqueforti FM164; XP_013327259.1, Amino acid sequence for lipase from Rasamsonia emersonii CBS.393.64; XP_002151838.1, Amino acid sequence for lipase from Talaromyces marneffei ATC18224; GAD_93521.1, Amino acid sequence for lipase from Byssochlamys spectabilis.
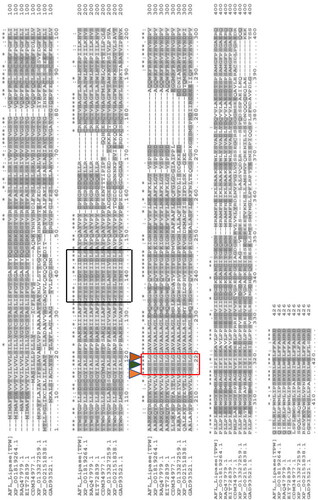
Figure 4. Prediction of putative Aspergillus flavus-like lipase (AFL) structure of the best fit model with a global model quality estimate (GMQE) value of 0.48 and a Qualitative Model Energy Analysis (QMEAN) value of -2.47. (A) Comparison with the non-redundant set of Proteins Database (PDB) structures, (B) Local quality estimate and (C) Three-dimensional structure representation.
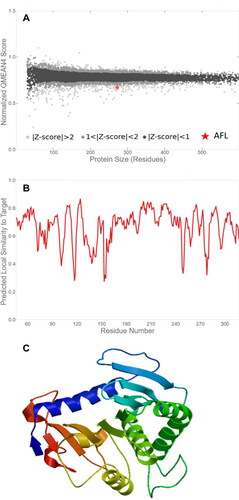
Figure 5. (A) Three-dimensional (3-D) structure of AFL-Lipase generated with PyMol software v2.0 along with the identified amino acid at the active site. The nucleophilic elbow is represented in sticks; Glycine 202 and 206 (red), Serine 204 (blue), Histidine (green), Lysine (cyan). Active site lid (residues 129-140, purple). (B) Zoomed catalytic site (Glycine 202 and 206, red); Serine 204 (blue) and the active site lid (purple).
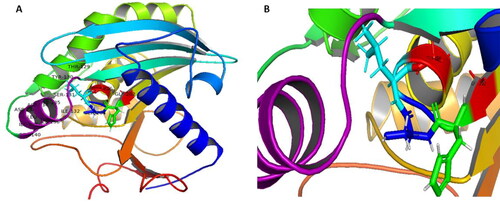
Figure 6. Ramachandran plot for the Aspergillus flavus lipase (AFL) model structure.
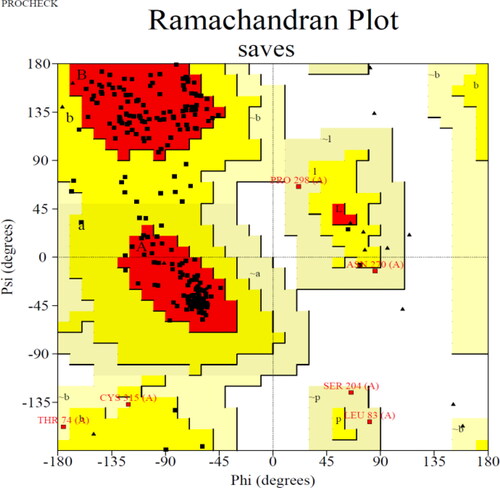
Figure 7. Predicted N-glycosylation using NetNglyc version 1.0. High glycosylation potentials were predicted at positions 164, 236 and 333 with a potential of 0.7250, 0.7037 and 0.7048, respectively. Minimum threshold = 0.5.
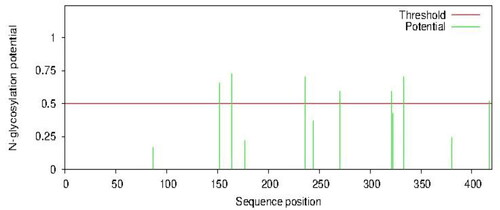
Figure 8. Predicted signal peptide position in AFL-Lipase protein sequence using signal version 5.0 tool.
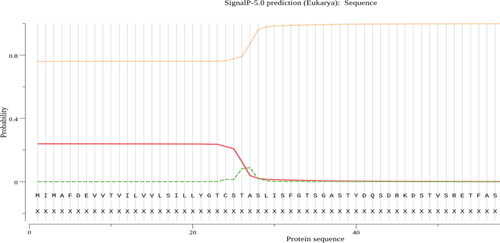
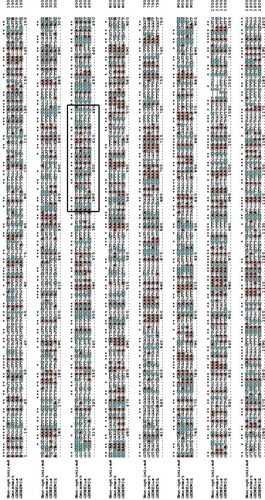
Figure 9. Multiple alignment codon-optimized AFL (Aspergillus flavus lipase) nucleotide sequence for expression in Pichia pastoris using Genesmart, GENEWIZ and GENEius optimization tools. Star symbol (*) indicates that the four sequences share the same nucleotides at a given position. A (adenine) coloured in orange; C (cytosine), coloured in cyan; G (guanine) and T (thymine), not coloured. The black box represents the active site lid sequence.