
Figures & data
Figure 1. Chemical structures of the ERα ligands. (A) Estradiol, the endogenous stimulatory ERα-ligand (ChemSpider ID: 5554). (B) ZEA, the stimulatory mycoestrogen (ChemSpider ID: 4444897). (C) 4-Hydroxytamoxifen, the synthetic selective estrogen-receptor modulator (ChemSpider ID: 395987).
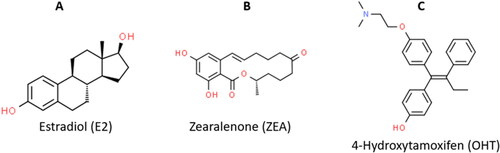
Figure 2. Basic chemical structures of several different flavonoid classes (Panche et al., Citation2016).
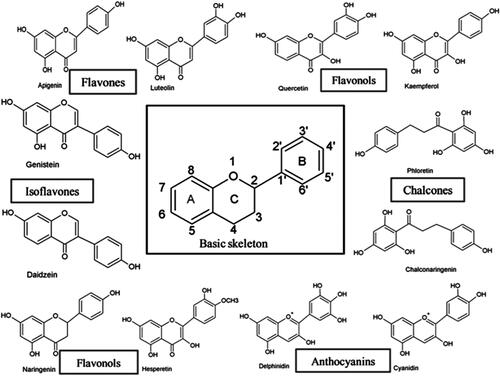
Figure 3. X-ray crystallography structures of the ERα ligand binding domain (LBD). (A) The LBD encompasses helices: H1-H12. The ligand binding pocket is comprised of H3, H6, H8, H11 and H2, PDB ID: 3ert. (B) ERα LBD complexed with zearalenone in the active/closed conformation, PDB ID: 5krc. (C) ERα LBD complexed with 4-hydroxytamoxifen in the inactive/open conformation, PDB ID: 3ert. (D) The apo form of ERα LBD complexed with 17β-estradiol, PDB ID: IA52.
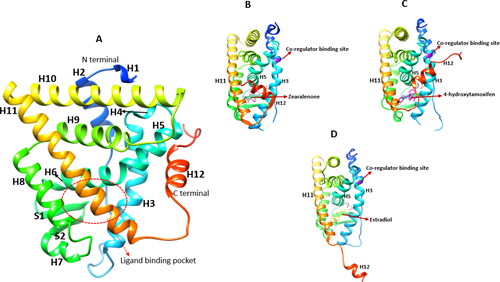
Table 1. Flavonoid compounds obtained from the Biological Magnetic Resonance Data Bank.
Figure 4. 2 D structures of the flavonoids.
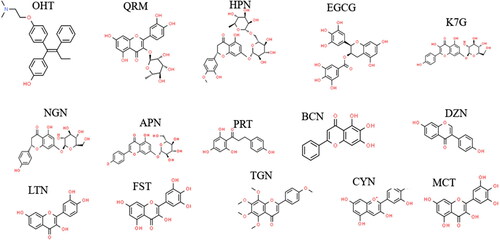
Figure 5. Lateral view of ERα LBD showing the validation of the docking protocol. The original crystal ERα LBD structure (PDB: 3ert) in green was superimposed with the newly docked complex (in blue and OHT in brown). RMSD = 0.004A˚.
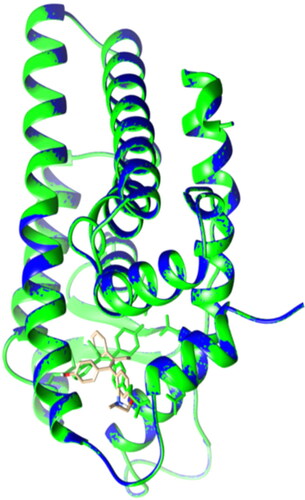
Table 2. Thermodynamic binding free energy components (Kcal/mol) for all the flavonoids compared to OHT (reference drug).
Figure 6. (A) The RMSD plots of Cα for the apo (black), OHT (red), HPN (cyan) and QRM (purple). (B) The RMSD plots of Cα apo (black), OHT (red), K7G (green) and QRM (blue).
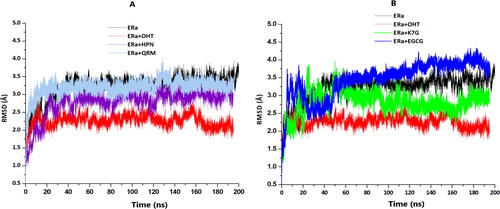
Figure 7. Radii of gyration (RoG)of apo and bound systems were measured over a 200 ns simulation. Data obtained were presented as a plot exhibiting the differences arising in radius deviation between the apo and bound systems. (A) The RoG plots for apo(black), OHT (red), HPN (cyan) and QRM (purple). (B) The RoG plots for apo (black), OHT (red), K7G (green) and QRM (blue).
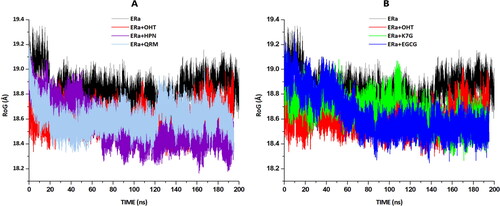
Figure 8. (A) The RMSF plots for the apo system (black), OHT complex (red), HPN (cyan) complex and QRM (purple) complex. (B) The RMSF plots for the apo system (black), OHT (red) complex, K7G (green) complex and QRM (blue) complex.
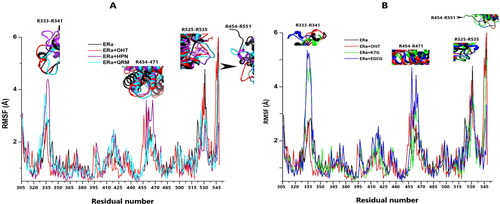
Table 3. The average Cα RMSF values of specific regions of the ER LBC.
Figure 9. The graphical representation of HPN, QRM, EGCG and K7G residue interactions within the LBD of ERα.
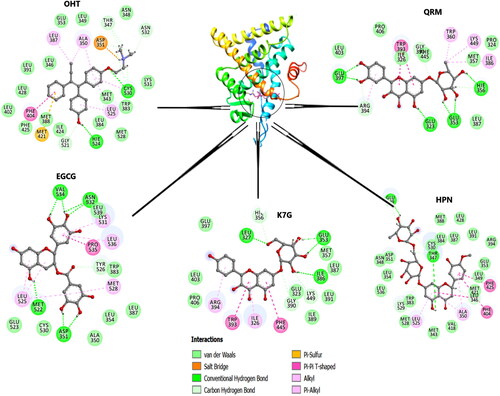
Table 4. The flavonoid- ERα interaction details. The number of interactions and the interacting residues.