Figures & data
Figure 1. Aerial parts of C. europaea: ((a) Stem; (b) Flower).
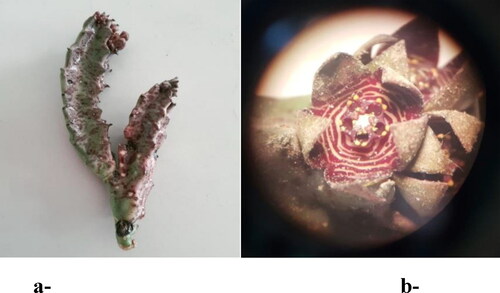
Table 1. Receptor grid coordinates of human Smo receptors (PDB ID).
Figure 2. LC–MS/MS results based on AUC (Area Under Curve) of Caralluma europaea hydroethanolic extract phenolic compounds through direct infusion.
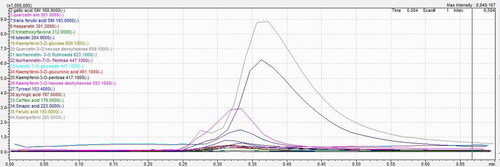
Table 2. Principal phenolic compounds revealed in C. europaea hydroethanolic extract through direct infusion.
Table 3. Effect of C. europaea hydroethanolic extract on weekly body weight gain of rat groups (n = 5). Values expressed as mean ± SEM.
Table 4. Effect of C. europaea extracts on weekly body weight gain of rat groups (n = 5). Values expressed as mean ± SEM.
Table 5. The relative organ weight (ROW) results of rats treated orally with C. europaea hydroethanolic extract. Values are expressed as mean ± SEM (n = 5).
Table 6. The relative organ weight (ROW) results of rats treated orally with C. europaea extracts. Values are expressed as mean ± SEM (n = 5).
Table 7. Effects of C. europaea hydroethanolic extract on the liver (aspartate transaminase (AST), alanine aminotransferase (ALT)), and the kidney (creatinine (CREA) and urea) quantification during the acute toxicity test. (*) indicates a significant difference at p < 0.05 from the control group using one-way ANOVA followed by Dunnett test. Values are expressed as mean ± SEM (n = 5).
Table 8. Effects of hydroethanolic, polyphenols, flavonoids and saponins extracts on the liver (aspartate transaminase (AST), alanine aminotransferase (ALT)), and the kidney (creatinine (CREA) and urea) quantification during the subacute toxicity test.
Figure 3. Histopathological photomicrographs of kidney and liver slices stained with hematoxylin-eosin (×40) after oral administration of C. europaea hydroethanolic, polyphenols, flavonoids and saponins extracts in rats on day 28 of the subacute toxicity. (A–E) Kidney section of groups treated with NaCl, hydroethanolic, polyphenol, flavonoid and saponin extracts, respectively. (F–J) Liver section of groups treated with NaCl, hydroethanolic, polyphenol, flavonoid and saponin extracts, respectively. A, Arteriole; G, Glomerulus; CPT, Peritubular capillaries; VC, Central vein; VP, Portal vein; CB, Bile duct; HA, Hepatic artery; H, Hepatocyte; N, Neutrophil; L, Leukocyte.
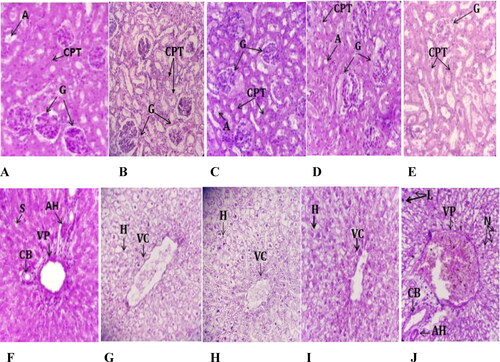
Figure 4. Bx-PC3 (A) and MIA PaCa-2 (B) cells were cultured for 72 h in the presence of C. europaea extracts with different doses of total extract, polyphenols, flavonoids and saponins. Cell survival was measured by MTT assay. Values are expressed as mean ± SEM (n = 3). *p < 0.05 compared to the control.
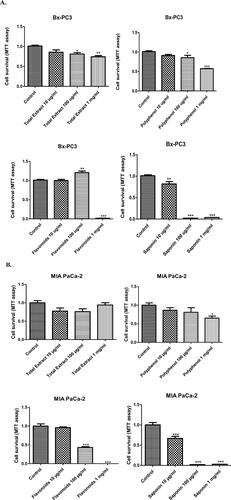
Figure 5. Photomicrographs of Bx-PC3 (A) and MIA PaCa-2 (B) cells treated with various doses of C. europaea extracts. Images 10x.
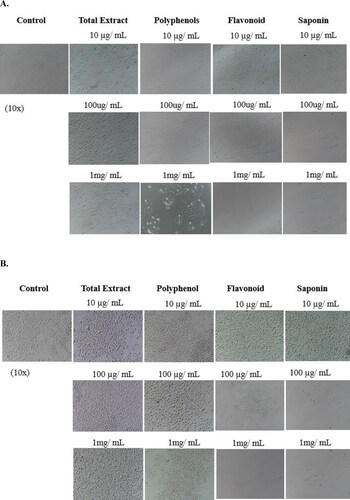
Figure 6. Bx-PC3 (A) and MIA PaCa-2 (B) cells were incubated with C. europaea extracts alone, and in combination with gemcitabine. Values are expressed as mean ± SEM (n = 3). *p < 0.05 compared to the control.
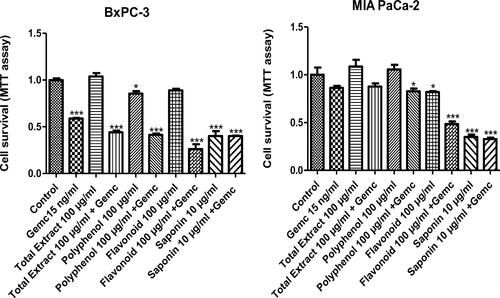
Figure 7. Bx-PC3 (A) and MIA PaCa-2 (B) were cultured for 72 h with C. europaea extracts. Protein levels of Nanog, Sox-2 and CD133 were determined by western blotting. GAPDH was used to demonstrate equal loading, and for purpose of quantifying the ratio of the band intensities.
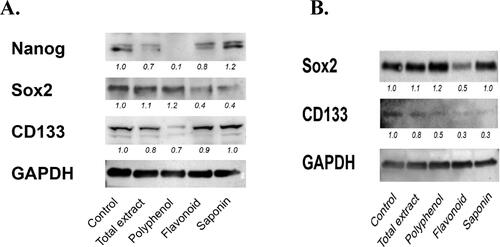
Figure 8. Internucleosomal DNA fragmentation. (A) MIA PaCa-2 cells; (B) MIA PaCa-2 gemcitabine resistant cells. Values are standardized to the control. Values are expressed as mean ± SEM (n = 3). *p< 0.05 vs. control.
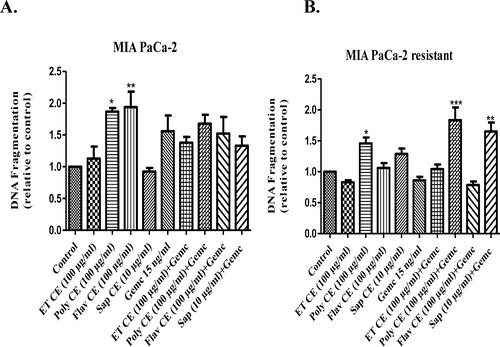
Table 9. Docking results with ligands in human Smo and Caspase-3 receptor.
Figure 9. 2D diagrams of ligands interactions with the active sites. (A) Luteolin 7-O-glucoside interactions with the active site of 5L7I. (B and C) Luteolin interactions with the active site of 4QIM and 4QIN, respectively. (D) Isorhamnetin-3-O-rutinoside interactions with the active site of 4O9R. (E) Trimethoxyflavone interactions with the active site of 4N4W. (F) Isorhamnetin-3-O-rutinoside interactions with the active site of the Caspase-3 receptor (3GJQ).
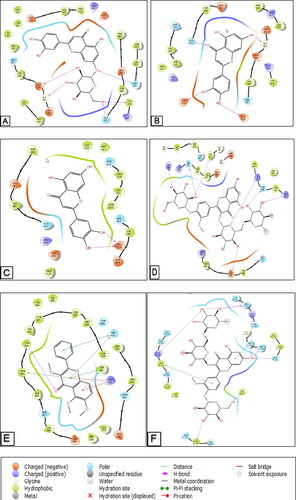
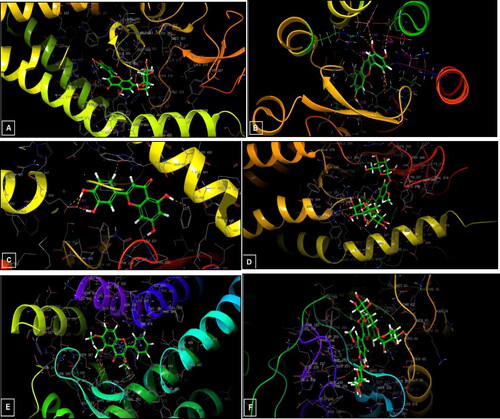
Figure 10. 3D diagrams of ligands interactions with the active sites. (A) Luteolin 7-O-glucoside interactions with the active site of 5L7I. (B and C) Luteolin interactions with the active site of 4QIM and 4QIN, respectively. (D) Isorhamnetin-3-O-rutinoside interactions with the active site of 4O9R. (E) Trimethoxyflavone interactions with the active site of 4N4W. (F) Isorhamnetin-3-O-rutinoside interactions with the active site of the Caspase-3 receptor (3GJQ).