
Figures & data
Figure 1. Multiple alignment of non-redundant and mature cytotoxin (CTX) sequences from different Naja sp. (Serpentes, Taxid = 8570). The conserved amino acid sequence of CTX was blasted against NCBI blastp. The three hydrophobic loops were annotated to represent the characteristics of three-finger functional loops in CTX.
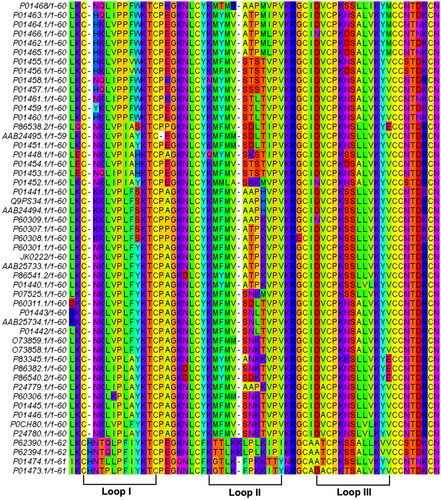
Table 1. The conserved CTX sequence was acquired from multiple sequence alignments of the non-redundant and mature CTX sequences (Naja, Taxid: 8570).
Figure 2. Homology modeling of conserved cytotoxin (CTX). (A) DOPE energy score profile shows the alignment of conserved CTX model and template (1ug4A); (B) The superimposed image for both the template (1ug4A) and conserved cytotoxin. Blue represents the template (1ug4A) while the red represents the conserved CTX model; (C) Ramachandran plot of conserved CTX to visualize the energetically allowed regions for a polypeptide backbone at different angles ψ against φ of amino acid residues. The red region is the most favored region, whereas the yellow region represents additionally allowed region. The pale-yellow region represents for the generously allowed region. The white region is the disallowed region; (D) Three-dimensional structure of conserved CTX determined from Modeller version 9.19, using cytotoxin from Naja atra venom (1ug4A) as the template.
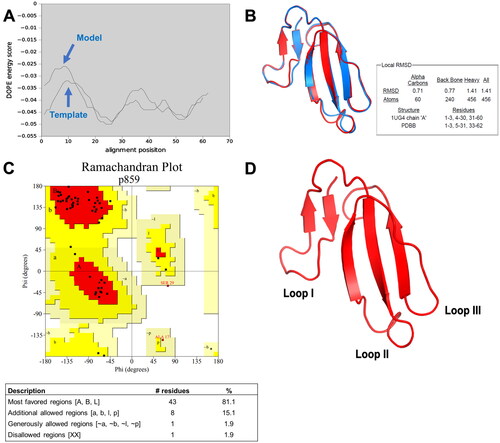
Table 2. The death receptors and their characteristics.
Table 3. The docking parameters of conserved cytotoxin (CTX) with different death receptors by molecular docking on HADDOCK2.2.
Figure 3. Docking complex between conserved cytotoxin (CTX) and death receptor families. The death receptors colored in red whereas CTX colored in blue. The functional loops I to III of CTX are numbered. (A) a complex between DR3 and CTX; (B) a complex between DR4 and CTX; (C) a complex between DR5 and CTX; (D) a complex between DR6 and CTX; (E) a complex between CD95 and CTX; (F) a complex between TNFR1 and CTX; (G) a complex between TNFR2 and CTX. Abbreviations: DR3, death receptor 3; DR4, death receptor 4; DR5, death receptor 5; DR6, death receptor 6, CD95, Fas/APO-1; TNFR1, tumor necrosis factor receptor 1; TNFR2, tumor necrosis factor receptor 2.
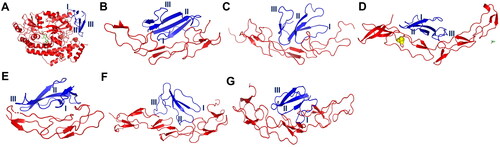
Figure 4. Molecular dynamics (MD) simulation of (A) conserved cytotoxin (CTX) and (B) tumor necrosis factor receptor 1 (TNFR1) in an aqueous environment. The system after equilibration was represented in its respective simulation box. The water is colored in grey while the protein is annotated as green ribbon, and the blue molecules are Cl− ions. The RMSF fluctuation plots of CTX and TNFR1 were illustrated. The RMSD of the backbone of each protein molecule for 50 ns of simulation in an aqueous environment; the gray line in RMSD plots represents the raw RMSD values, while the red line represents a polynomial approximation of the third order based on a floating window of 50 points. RMSD-based clustering of the MD trajectories was performed to obtain the conformational structures of the CTX and TNFR1 for ensemble-based molecular docking. Four clusters were obtained for CTX, and 5 clusters obtained for TNFR1. For each system, a timeline barplot representing the belonging to each cluster throughout the MD simulation was reported.
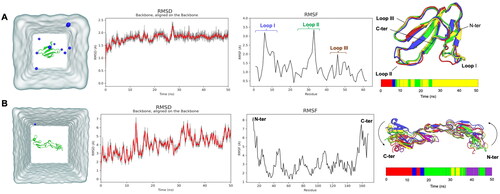
Table 4. The docking parameters of ensemble structures of conserved cytotoxin (CTX) with tumor necrosis factor receptor 1 (TNFR1).
Figure 5. The molecular docking of ensemble conformational ensemble 3 (CE3) of cytotoxin (CTX) and tumor necrosis factor receptor 1 (TNFR1). (A) CTX is colored in blue while TNFR1 is in red color; the pink region represents three hydrophobic loops of CTX while green region indicates the interacting sites of TNFR1. The representative interactions between functional loops I–III of CTX with TNFR1 were illustrated in figures (B) to (D), respectively. The red color dashed lines indicated hydrogen bonds.
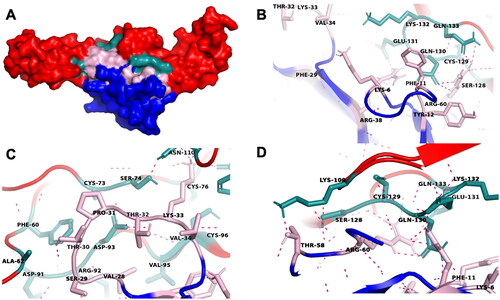
Figure 6. A schematic diagram of the residue interaction network between conserved cytotoxin (CTX, annotated as A) and tumor necrosis factor receptor 1 (TNFR1, annotated as B) in CE3. This interaction network was generated using RING 2.0. The interacting chains are shown as different colored lines representing different non-covalent forces. The amino acid residues involved in the direct interaction between CTX and TNFR1 were labeled. The yellow residues indicate the functional loops of CTX, while the green residues represent the TNF-α ligand binding sites of TNFR1. Abbreviations: VDW, Van der Waals; SSBOND, disulfide bonds; HBOND, hydrogen bonding; PIPISTACK, π-stacking; IONIC, ionic bonds; PICATION, π-cation.
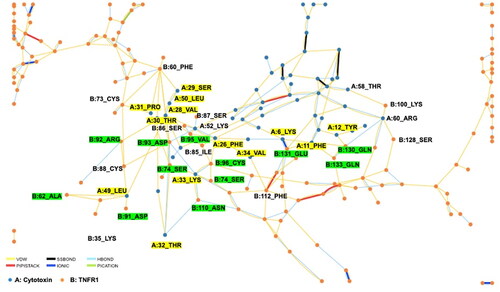
Figure 7. Fluorescence quenching titration curves of tumor necrosis factor receptor 1 (TNFR1) in the presence of increasing concentrations of cytotoxin (CTX) at different (A) 0 min, (B) 10 min, (C), 20 min and (D) 30 min.
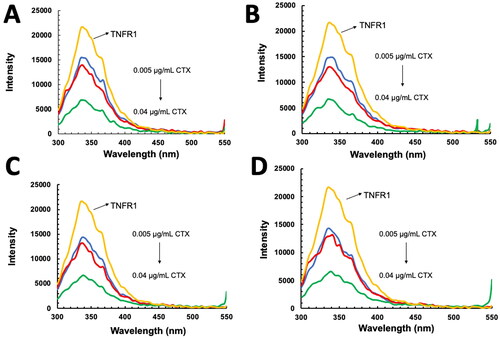
Figure 8. Fluorescence data analysis of interaction between tumor necrosis factor receptor 1 (TNFR1) and cytotoxin (CTX). (A) Stern–Volmer plot of TNFR1–CTX interactions; (B) Double logarithmic plot of TNFR1-CTX interactions, obtained from fluorescence quenching analysis at four different time points.
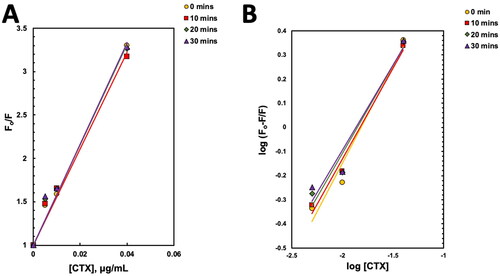
Table 5. The Stern–Volmer constants obtained from the slope of Stern–Volmer plot.
Table 6. The binding parameters of CTX–TNFR1 interaction obtained from double-logarithmic plot.