
Figures & data
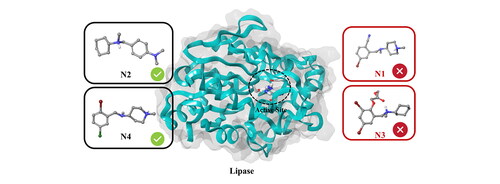
Figure 1. (A) Hydrolysis of triglycerides. (B) Catalytic mechanism of lipolysis in Pseudomonas aeruginosa (adapted from Jegannathan et al., Citation2008 and Röttig et al., Citation2010).
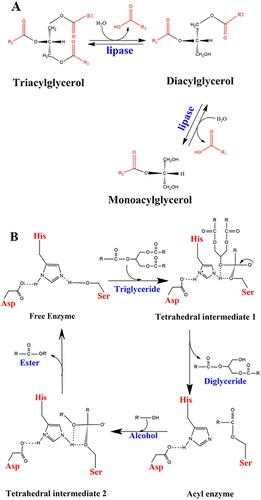
Table 1. Docking score values and free energies of binding (MMGBSA) for each compound, obtained from the virtual screening.
Figure 2. The structure of Pseudomonas aeruginosa lipase with the catalytic triad in stick model and the four alpha-helices of the cap domain indicated in yellow.
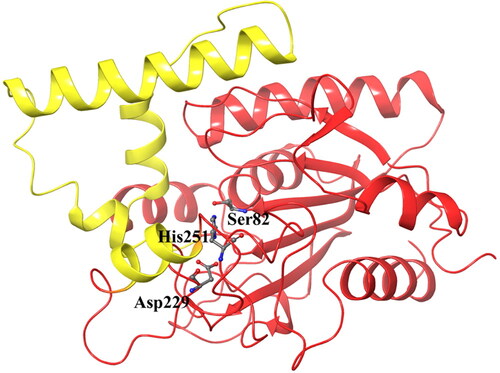
Figure 3. Chemical structures of Bromhexine and the compounds identified in this work.
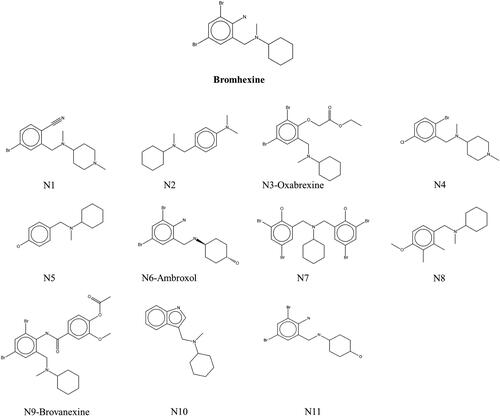

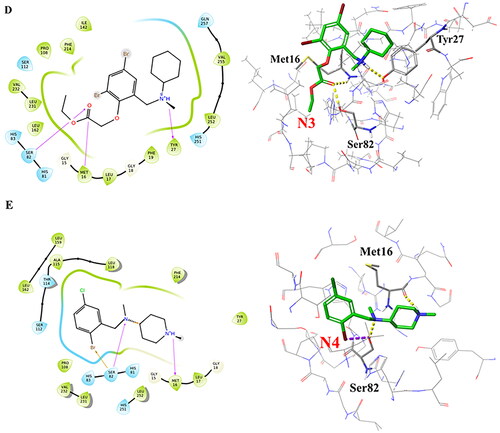
Figure 5. Root-mean-square deviation (RMSD) values for the 11 hits and the reference compound during one of the 200 ns MD simulations. (A) RMSD values for the 4 best hit compounds N1-N4, (B) RMSD values for the 7 hit compounds N5-N11, (C) Root mean square fluctuations (RMSF) of the lipase protein during the 200 ns MD simulations in complex with Bromhexine or ligands N1-N4. Red arrows correspond to the location of catalytic residues. Black arrows indicate which parts of the protein that undergoes more movements during the simulation (see text for details).
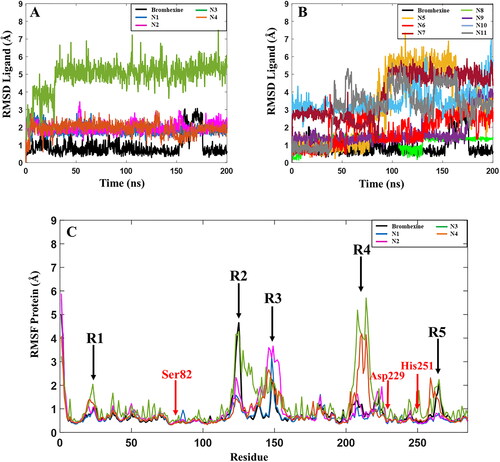
Table 2. 50% inhibition concentration of the lipase inhibitors.
Figure 6. Structural changes in the lipase protein. (A) Lipase structure (PDB ID 1EX9) containing phosphonate trioctyl as ligand. (B) Lipase structure containing Bromhexine after 200 ns MD simulation. The changes in the conformation of the key α-helix is indicated with the dashed circle.
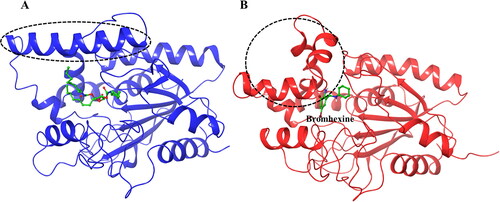
Figure 7. Graph of hydrogen bonds for Bromhexine and compounds N1-N4 during a 200 ns MD simulation.
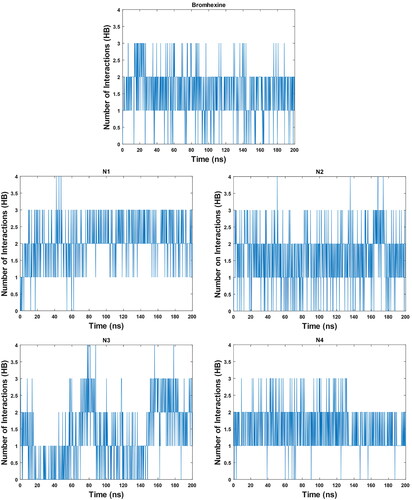
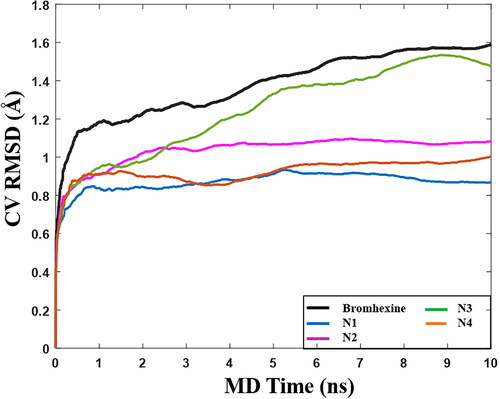
Figure 8. Graph of RMSD estimate averaged over 10 BPMD trials for Bromhexine and compounds N1-N4 binding to Lipase, vs simulation time.
Supplemental Material
Download PDF (2.9 MB)Data availability
All docked structures, MD simulation trajectories, and BPMD data are available as free download from Zenodo.org, DOI: 10.5281/zenodo.7003747.