
Figures & data
Table 1. Alignment of E. coli FtsZ protein (obtained by translating Gene: ftsZ (EC2860050_0094)) with various subject sequences using the Standard Protein Blast algorithm.
Figure 1. E. coli FtsZ model built using templates given in .
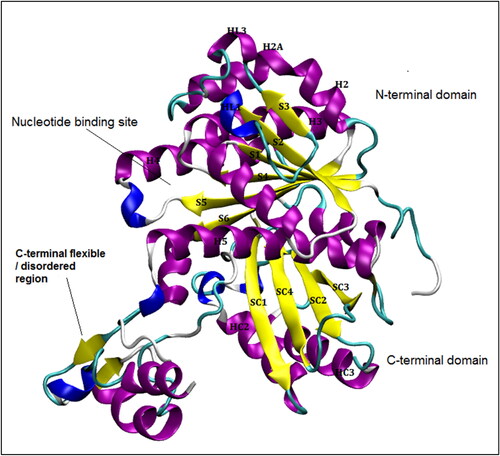
Table 2. Template crystal structures for constructing E. coli FtsZ homology model.
Figure 2. Position of the nucleotides in NPT equilibrated structures: GDP in 2VAW reference (blue), GDP in 2 simulations (red), 2 different orientations of GTP in 5 simulations (green).
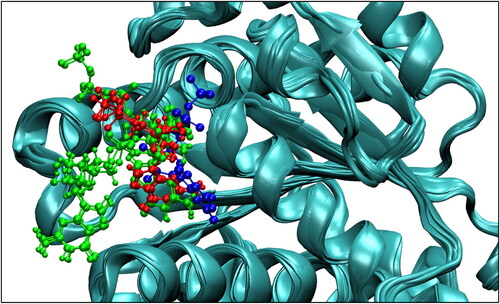
Figure 3. (a) PrDos 2 state prediction (False positive rate 5%) Red: Disordered residues, Black: Ordered residues. (b) Ramachandran distribution map of I) model phi and psi angles II) intrinsically disordered region in the protein.
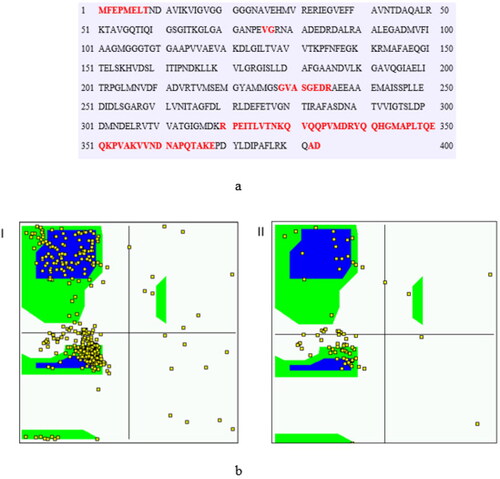
Figure 4. (a–f) Structure of the protein in the wild-type monomer simulation WT-FtsZ mono-GDP (1) at every 20 ns from t = 0 ns to t = 100 ns during MD simulation: (a) t = 0 ns, (b) t = 20 ns (c) t = 40 ns, (d) t = 60 ns, (e) t = 80 ns, (f) t = 100 ns. The frames were aligned for the backbone atoms residues 12–311.
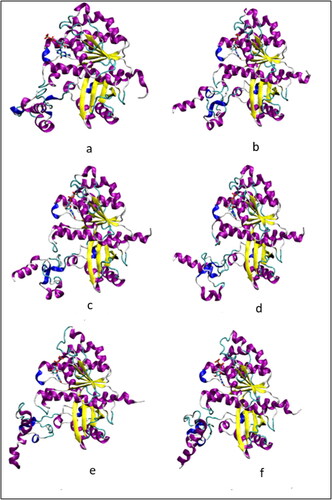
Figure 5. (a, b) FtsZ simulations without nucleotide, frame considered at 93.9 ns simulation time. (c,d) FtsZ simulations with GDP. (e-i) FtsZ simulations with GTP. VMD ‘new cartoon’ representation is used for the protein and ‘secondary structure’ colour scheme is used. ‘CPK model’ representation is used for nucleotide and coloured based on atom name; and ‘CPK model’ for Mg2+ ion, coloured in black. The bending of the central helix is shown using a red line drawn through the helix.
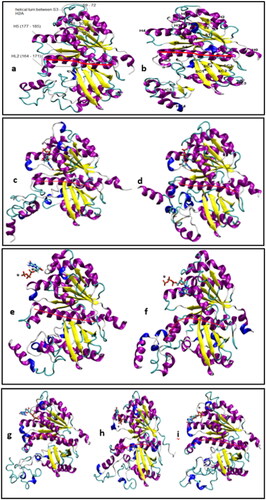
Figure 6. (a-c) RMSD of backbone atoms of residues 12–311 of the globular tubulin like core of FtsZ in (a) WT-FtsZ mono-empty (1) (red) and WT-FtsZ mono-empty (2) (green). (b) WT-FtsZ mono-GDP (1) (red) and WT-FtsZ mono-GDP (2) (green).(c) WT-FtsZ mono-GTP (1) (red), WT-FtsZ mono-GTP (2) (green), WT-FtsZ mono-GTP (3) (blue), WT-FtsZ mono-GTP (4) (cyan), WT-FtsZ mono-GTP (5) (magenta). Note : For RMSD calculation, the simulation trajectory frames were aligned on backbone atoms of residues 12–311 of the structure obtained after respective NPT equilibrations.
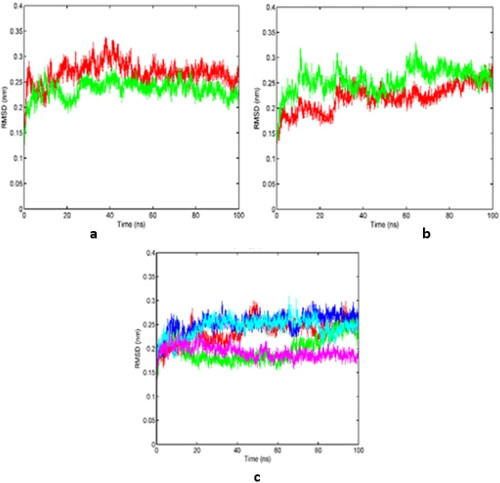
Figure 7. RMSF of protein backbone atoms and averaged per residue from 20–100 ns WT-FtsZ mono-empty (red); WT-FtsZ mono-GDP (blue) WT-FtsZ mono-GTP (green).
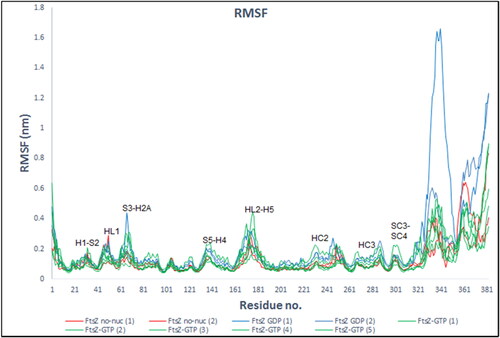
Table 3. Hydrogen bonds between nucleotide and protein.
Figure 8. (a-i) Principal motion along the first eigen vector for (a,b) WT-FtsZ-empty (1) and (2), (c,d) WT-FtsZ-GDP (1) and (2) and (e–i) WT-FtsZ-GTP (1), (2), (3), (4) and (5). The position of atoms at different simulation timesteps is shown using the ‘CPK’ representation in VMD. The ‘trajectory-timestep’ colour scheme in VMD has been used with the ‘RGB’ colour scale such that the first frame (t = 100 ps MD simulation time) is in red and the frame at t = 100,000 ps is in blue.
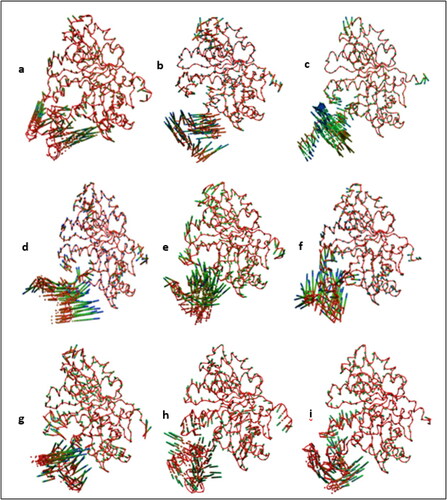
Figure 9. Alignment of average Cα coordinates after superpositioning Cα atoms of N-terminal residues 12–164: WT-FtsZ mono-empty simulations (blue), WT-FtsZ mono-GDP simulations (red), WT-FtsZ GTP simulations (magenta and green).
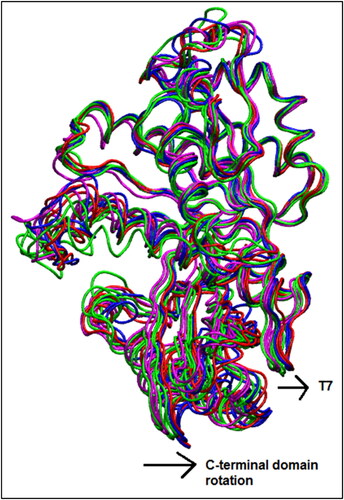
Table 4. Contacts between the IDR and the globular core (contact maps provided in SI).