Figures & data
Figure 1. Protein’s 3D structure was taken from the PDB along with a Ramachandran plot showing various regions of the target protein’s structure.
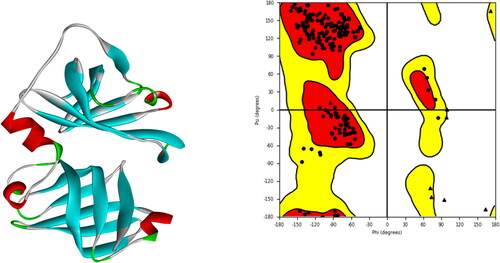
Figure 2. Ligand based pharmacophore and selected ligand fit on pharmacophore hypothesis.
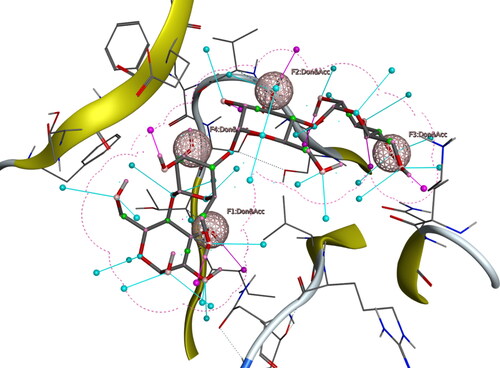
Table 1. Table showing ADMET properties, binding affinity, and pharmacophore score of top compounds.
Figure 3. ROC curves of docking validation score.
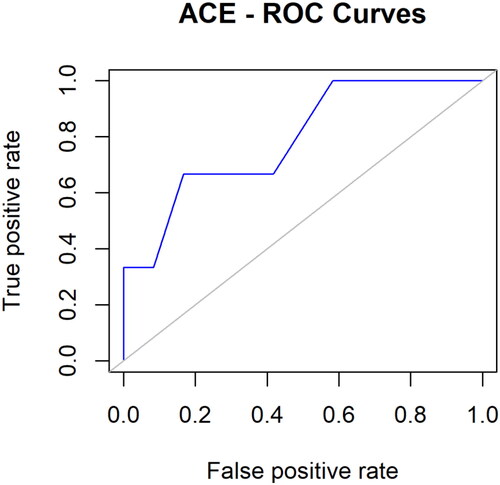
Figure 4. Interactions of the lead compound with protein target showing interacting residues and length of the bond.
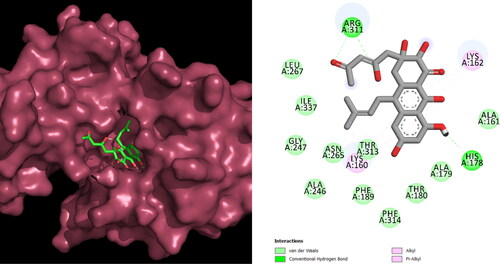
Figure 5. Root mean square distance (RMSD) changes over time between the C-alpha atoms of proteins and their ligand (NPA024823-3rn2). On the left Y axis, protein RMSD shifts over time are displayed. The right Y-axis displays changes in ligand root-mean-square distance (RMSD) over time.
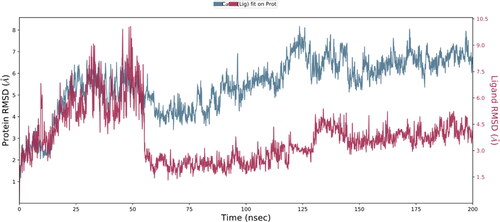
Figure 6. (A) Principal Components analysis plotting of eigenvalue vs. Variance% (NPA024823-3rn2). the various regions are displayed using three separate components. Variations in PC1, PC2, and PC3 are correspondingly 20.0 percentile, 12.9 percentile, and 9.0 percentile. For 107876-3rn2, see (B) a complex DCCM. The positive and negative associations between the residues are represented by the colors cyan and purple, respectively.
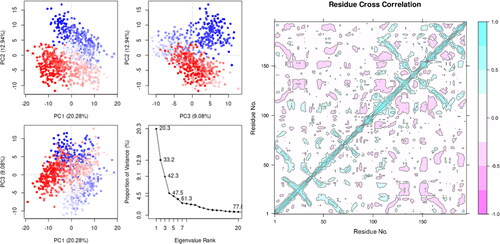
Figure 7. Residue-wise root mean square fluctuation (RMSF) of protein complexed with ligand.
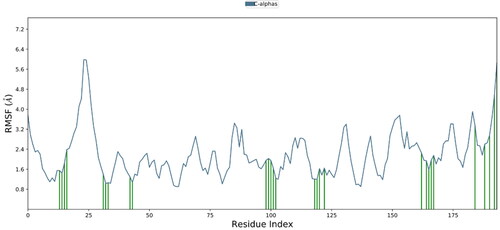
Figure 8. Depending on the residue index, proteins’ secondary structural components are distributed among protein-ligand complexes. The red columns stand in for alpha helices, while the blue ones are for beta strands.
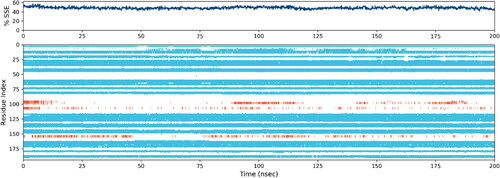
Figure 9. Protein-ligand contact heatmap throughout the trajectory.
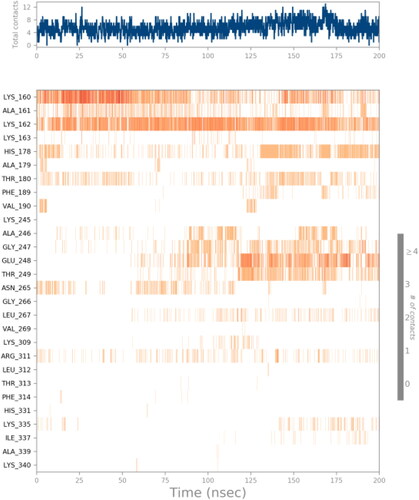
Table 2. Calculation of NPA024823's average MM-GBSA binding energy using AIM2 per 10 ns using MD simulation trajectories.
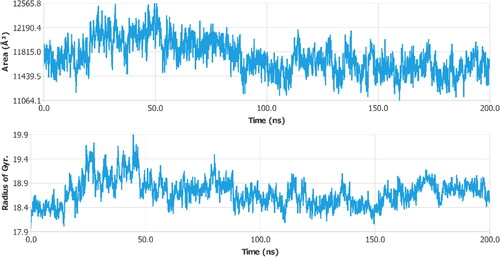
Figure 10. Radius of gyration and SASA calculated for three targets bound with ligand.