
Figures & data
Figure 1. PEDF inhibited the phosphorylation of downstream proteins. (A) Western blot determination of PEDF/VEGF protein expression in AMI. (B) Time-course analysis of protein expression. *p < 0.05, ***p < 0.001, #p < 0.05,##p < 0.01 versus the respective sham groups, n = 3. (C) The inhibition to phosphorylation was detected by western blot when PEDF is overexpressed. The expression of proteins (D) PEDF, (E) p-VEGFR2, (F) p-Src, and (G) p-VE-cadherin were analyzed. **p < 0.01, ***p < 0.001 versus the sham group, and ##p < 0.01, ###p < 0.001 versus the control group, n = 3.
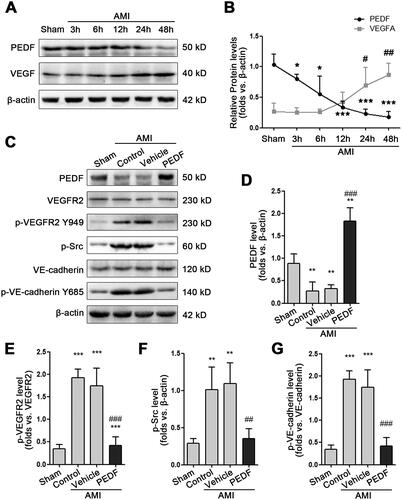
Figure 2. PEDF protect endothelium integrity. (A) Fluorescence imaging of VE-cadherin and CD31. (B) PEDF reduces blood vessel leakage. Fluorescence imaging of fibrinogen after incubation with PEDF.
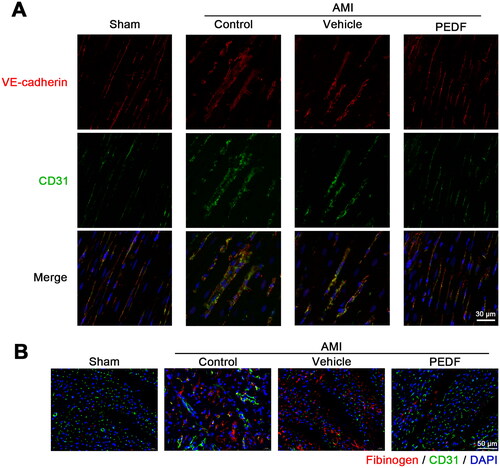
Figure 3. PEDF inhibits VEGF via binding to VEGFR2. (A) Heart tissue lysate was Co-IPed with anti-VEGFR2 antibody or rabbit IgG, and then analyzed by Western blotting with anti-PEDF and anti-VEGF antibody. Densitometry analysis of PEDF (B) and VEGF (C) levels versus the sham group. (D) Heart tissue lysate was Co-IPed with anti-PEDF antibody or rabbit IgG, and then analyzed by Western blotting with anti-VEGFR2 and anti-VEGF antibody. (E) Densitometry analysis of VEGFR2 level versus the sham group. ##p < 0.01 versus the control group, n = 3.
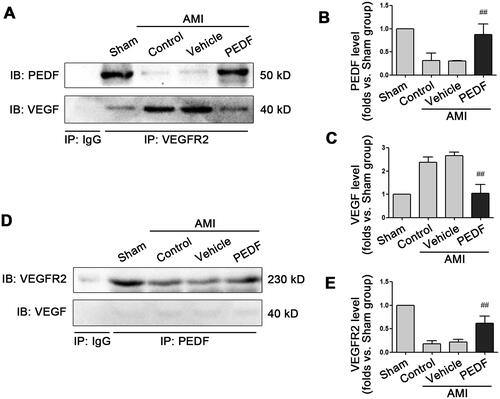
Figure 4. Molecular docking analysis. (A) The number of hydrogen bonds between VEGFR2 and VEGF (Blue line) or PEDF (Red line) during molecular dynamics simulation. (B) Binding energy between VEGFR2 and VEGF (Blue line) or PEDF (Red line) during molecular dynamics simulation. (C) Binding model of VEGFR2 docking with PEDF protein. Ribbon in green represents VEGFR2, grey represents PEDF, purple and blue linkers represent amino acid residues originating from VEGFR2 and PEDF, respectively, and green dashed lines represent hydrogen bonding interactions.
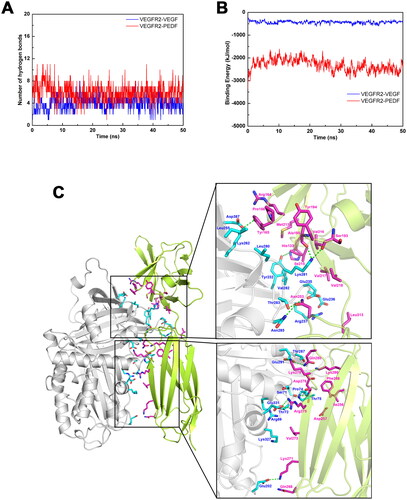
Figure 5. Peptides reduce blood vessel leakage. (A) Fluorescence imaging of fibrinogen after incubation with PEDF or peptides. (B) Relative fibrinogen in each group. *p < 0.05, ****p < 0.0001 vs the AMI group, and ####p < 0.0001 vs the AMI + PEDF group, sham group n = 6 and the other each group n = 10, ten fields of view per rat.
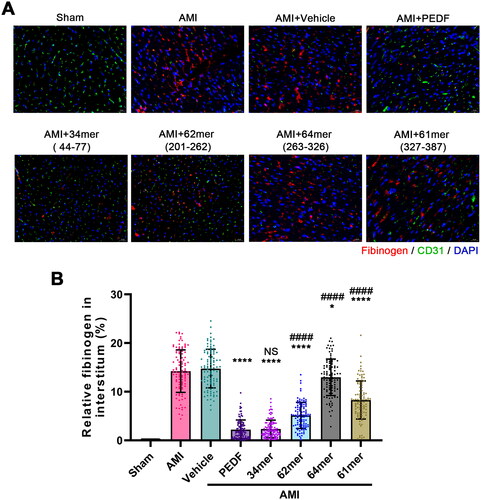
Figure 6. The 34mer peptide inhibited the phosphorylation of downstream proteins in a similar fashion to PEDF. (A) Representative Western blot image of phosphorylation of downstream proteins following PEDF or 34mer infection and overexpression during AMI. Densitometry analysis of (B) p-VEGFR2/VEGFR2, (C) p-Src/β-actin and (D) p-VE-cadherin Y685/VE-cadherin following infection with PEDF or 34mer peptide during AMI. (E) Heart tissue lysate was Co-IPed with anti-VEGFR2 antibody or rabbit IgG, and then analyzed by Western blotting with anti-PEDF, anti-34mer peptide and anti-VEGF antibody. #p < 0.05, ##p < 0.01 vs the control group, n = 3.
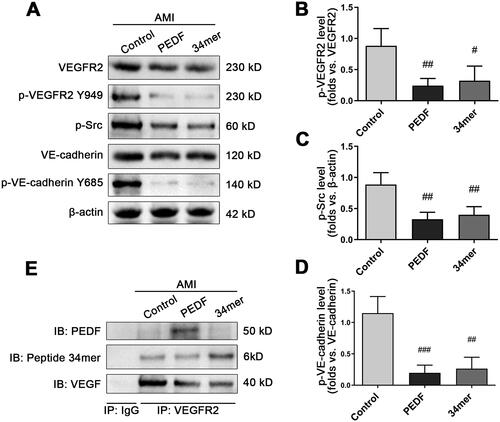
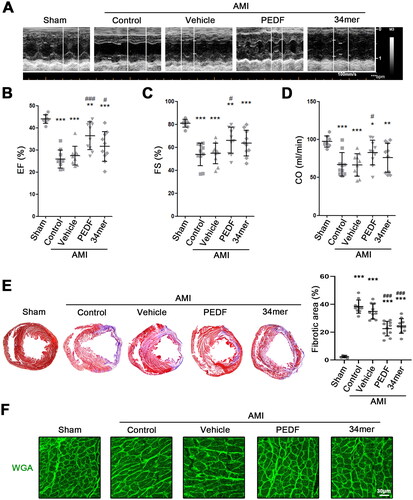
Figure 7. The 34mer peptide sustained cardiac function during AMI. (A) Representative echocardiogram of hearts during AMI. Scatter plot of (B) ejection fraction (EF) (%), (C) fractional-shortening (FS) (%) and (D) cardiac output (CO) (ml/min) of each group. (E) MTC staining and fibrotic area analysis of hearts in each group. (F) WGA staining analysis of cardiomyocyte remodeling in each group. *p < 0.05, **p < 0.01, ***p < 0.001 versus the sham group, and #p < 0.05, ###p < 0.001 versus the control group, sham group n = 6, the other each group n = 10.
Supplemental Material
Download MS Word (1.6 MB)Data availability statement
The data used to support the findings of this study are available from the corresponding author upon reasonable request.