
Figures & data
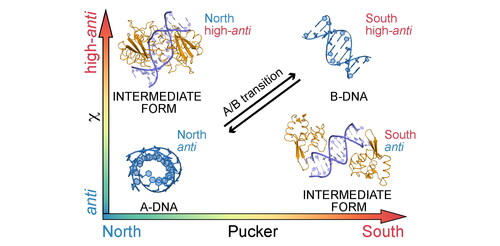
Figure 1. Sugar pucker and glycosidic torsion χ in A-DNA, B-DNA and two common intermediate conformers frequently found in protein-DNA complexes, present in dinucleotide conformations AA02 (P/χ = A/B) and BB16 (P/χ = B/A, see ref. Černý et al., Citation2020).
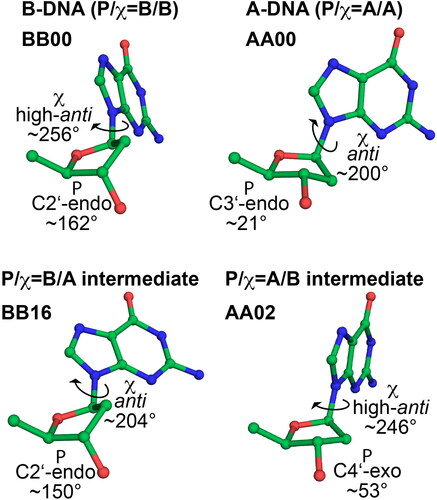
Table 1. An overview of the DNA force fields used.
Figure 2. Protein-DNA complexes studied in this work (PDB ID in the parentheses).
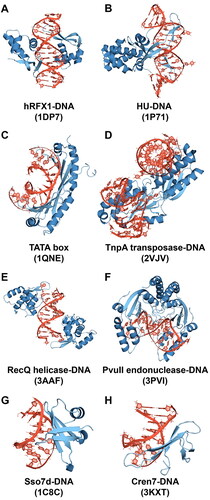
Table 2. Selected protein-DNA complexes, resolution of the X-ray structures, groove binding motif (M – major, m – minor) and protein structural element in contact with DNA (h – helix, s – sheet, l – loop). Terminal bases not included in the number of states.
Figure 3. Distributions of P and χ in nucleotides representative for B/B (dC106_B, 1C8C), A/B (dC114_C, 1C8C), B/A (dT29_D in 2VJV) and A/A (dC20_C, 2VJV). Dashed vertical lines represent reference values from X-ray (see text).
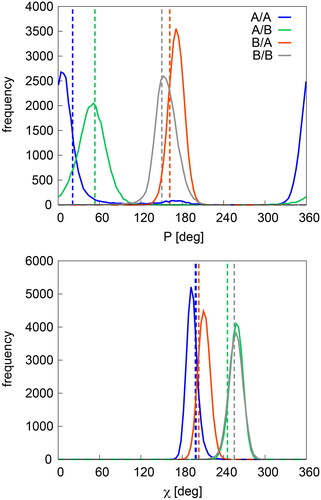
Figure 4. Sugar pucker and χ in OL15 simulations of selected residues with starting (native) P/χ = A/A state in the 1DP7 complex. Values separating A- and B- type P and χ are shown in pink and cyan, respectively; points on the y-axis indicate X-ray values.
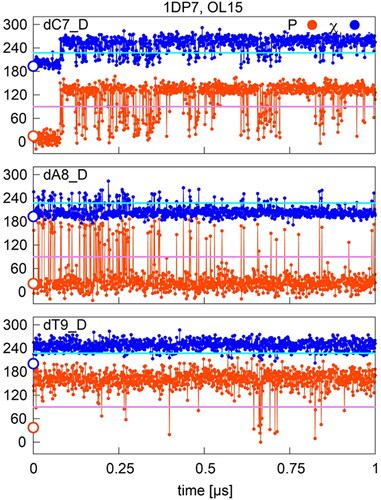
Figure 5. Sugar pucker and χ in OL15 simulations of selected residues with starting (native) P/χ = A/B state in the 3KXT complex. Values separating A- and B- type P and χ are shown in pink and cyan, respectively; points on the y-axis indicate X-ray values.
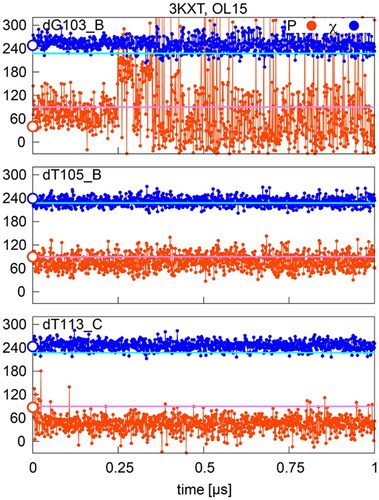
Figure 6. Sugar pucker and χ in OL15 simulations of selected residues with starting (native) P/χ = B/A state in the 2VJV complex. Values separating A- and B- type P and χ are shown in pink and cyan, respectively; points on the y-axis indicate X-ray values.
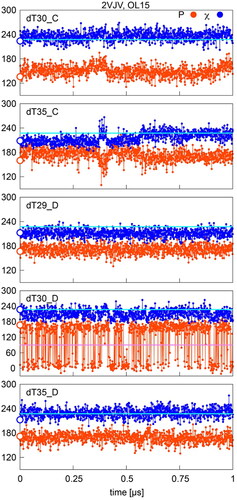
Table 3. Percentages of native X-ray P/χ = AA, AB, BA and AB states preserved in MD simulations (time averages over the simulation). Terminal residues were excluded.
Table 4. Percentage of P/χ = AA, AB, BA and AB states in MD simulations averaged over all structures, grouped by the native (starting) X-ray state. Populations of native states are highlighted in bold. Terminal residues were excluded.
Table 5. The propensity for different P/χ states in complexes and in their naked DNA averaged over all OL15 simulations.