
Figures & data
Figure 1. Schematic comparison between SCOP and CATH.
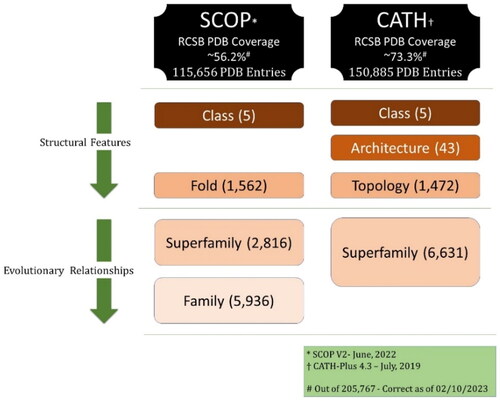
Figure 2. Two structures belong to the same Architecture (3-Layer (aba) Sandwich) with different Topologies (Left-to-right: (1) Rossmann fold, PDBID: 1A2B and (2) Ribosomal Protein L9, PDBID: 2HBA). Although the number and length of the secondary structures is quite different, they both share the same overall shape: beta-sheets surrounded by alpha helices. Images created using Mol* (Sehnal et al., Citation2021).
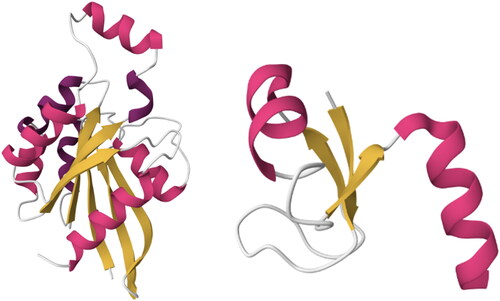
Figure 3. Distribution of 40 CATH Architectures amongst the 169,843 domains – Dataset #1.
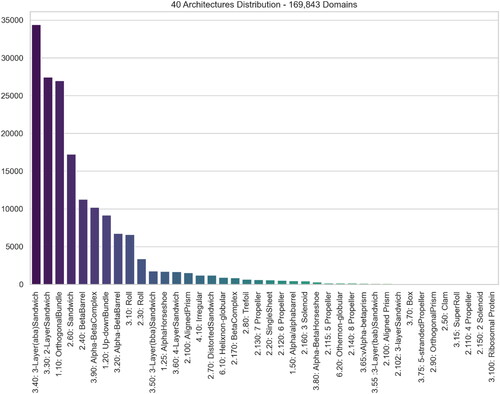
Figure 4. Distribution of 12 CATH Architectures amongst the 157,044 domains – Dataset #2.
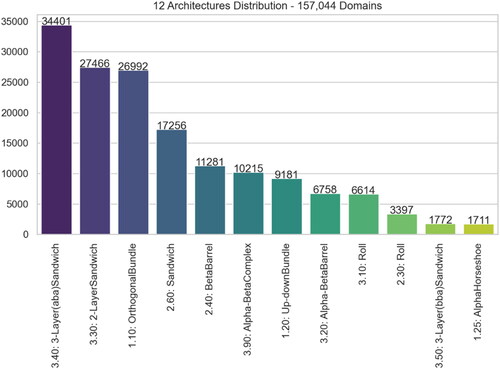
Figure 5. Distribution of 28 excluded CATH Architectures amongst the 12,799 domains – This represents Dataset #1 subtracted by Dataset #2.
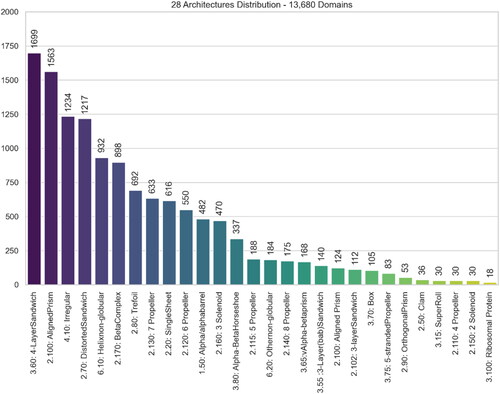
Figure 6. Flowchart of the Process to create both Datasets: 1 & 2 that contain in each row (domain), the Amino Acid Sequence, Protein Block Sequence and the Architecture ID.
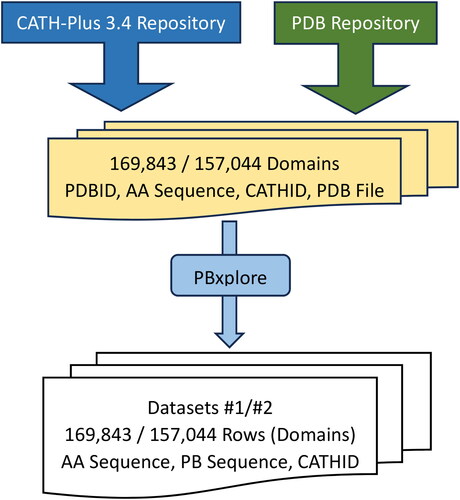
Figure 7. F1 Score of three algorithms at three experiments for both datasets. The first column is for Dataset #2 (12 classes) and the second column is for Dataset #1 (40 classes).
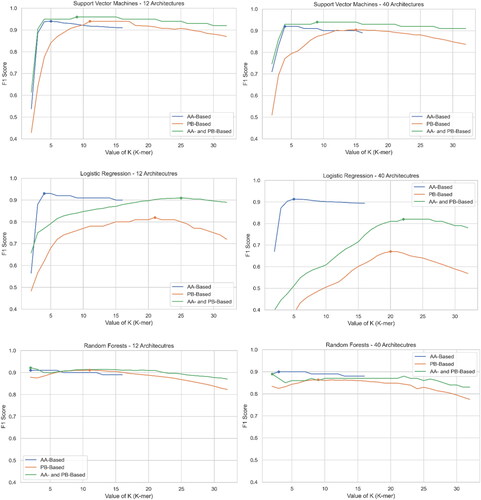
Table 1. Results (F1 Score) of Experiments 1 (using Sequence of Amino Acids), Experiments 2 (using Sequence of Protein Blocks) and Experiments 3 (Using Both Features) for the main Classes (Dataset 2 – 12 Architectures).
Table 2. Results (F1 Score) of Experiments 1 (using Sequence of Amino Acids), Experiments 2 (using Sequence of Protein Blocks) and Experiments 3 (Using Both Features) for All Classes (Dataset 1–40 Architectures).
Table 3. Comparison between averages of with .
Table 4. Results (F1 Score) of Extended Experiments 3 (using both features, Sequence of Amino Acids and Sequence of Protein Blocks) for both the main and 40 Classes (Datasets 1 & 2).
Figure 8. From Left to Right, structures of three proteins that belong to architectures 6.10 and 6.20: 2LH0 (6.10), 4GIP (6.10), 2CON (6.20). Images created using Mol* (Sehnal et al., Citation2021).
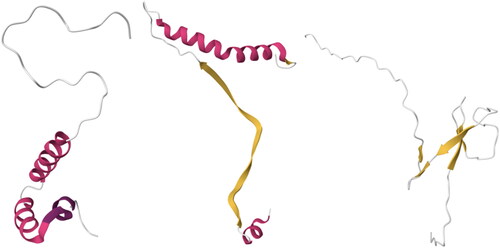
Table 5. Detailed F1 Score for SVM – 12 Classes – k = 5 (AA) K = 13 (PB).
Table 6. Detailed F1 Score for SVM – 12 Classes – k = 5 (AA) K = 13 (PB).
Figure 9. F1 Scores of 40-Classes SVM 80 experiments for each Architecture.
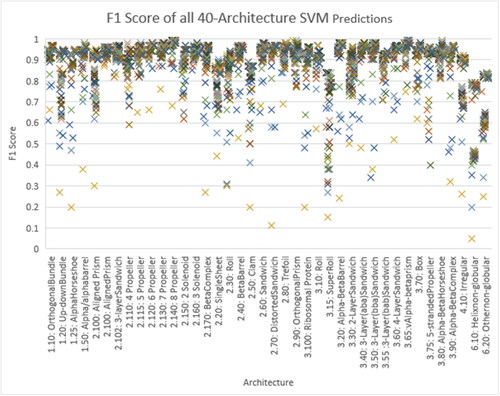
Table 7. Holdout dataset’s results.
Table 8. Final conclusion that includes the best 4 algorithms out of the study.
Data availability statement
The code and datasets developed in this study can be accessed at https://zenodo.org/records/10203431.