Figures & data
Figure 1. Schematic description of the recombinant overexpression and purification processes of PfGST and PvGST. The construct’s transformation in BL21(DE3) competent cells were successful as evident from the yield of single and distinct colonies on the LB plates. The 0.50 mM overexpressed was successfully purified using a one-step IMAC procedure. The PfGST and PvGST proteins were found to be pure, and their sizes correspond to the approximately 25 kDa theoretical sizes.
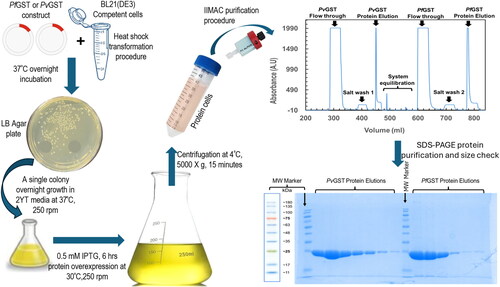
Figure 2. Characterization of PfGST and PvGST in terms of their enzymatic specific activity in the presence and absence of BSP through a GSH-CDNB conjugation assay (100 mM NaH2PO4 pH 7.2, 1 mM EDTA, 1 mM DTT, 5 mM GSH pH 6.5, 30 mM CDNB, and 1 mM BSP) monitored spectroscopically showing PfGST’s specific activity (black), PvGST’s specific activity (green), PfGST:BSP’s specific activity (red), and PvGST:BSP’s specific activity (blue).
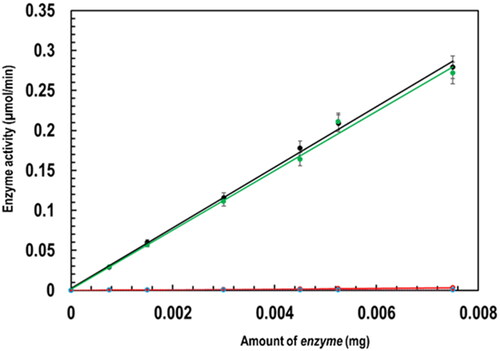
Figure 3. Ligandin activity of PfGST and PvGST through ANS fluorescence spectroscopy towards BSP and its effect on their tertiary structural conformation. A spectrofluorometric monitored ANS fluorescence emission at 395 nm excitation showing (A) emission spectrum of free ANS (grey), ANS bound PfGST (black) and ANS bound PvGST (green), (B) BSP complexed proteins’ emission spectrum of PfGST:BSP (red) and PvGST:BSP (blue), (C) reduced GSH incubated protein’s emission spectrum of PfGST-GSH (black) and PvGST-GSH (green), and (D) BSP complexed and GSH incubated proteins’ emission spectrum for PfGST:GSH:BSP (red) and PvGST:GSH:BSP (blue).
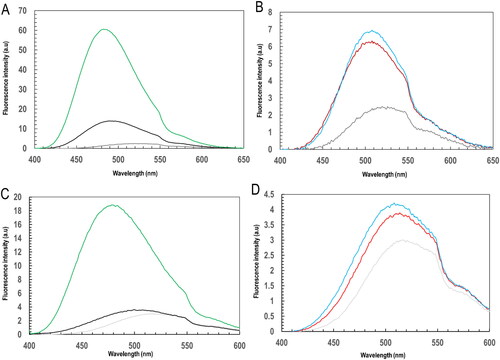
Figure 4. Profiles for the thermal stability using melting peak temperature of PfGST and PvGST in the presence and absence of GSH and BSP at temperature between 25 °C and 65 °C using a qPCR differential scanning fluorimetry evaluation. The fluorescence thermal shift assay was carried out in 100 mM NaH2P04, 1 mM DTT, and 1 mM EDTA, pH ± 1 mM GSH, ± BSP, with sample monitored in triplicate. The derived -d(RFU)/dT against temperature (C) plots showing melting peak temperature Tm in °C of (A) PfGST (black) and PvGST (green), (B) PfGST:GSH (black) and PvGST:GSH (green), (C) PfGST:BSP (red) and PvGST:BSP (blue), and (D) PfGST:GSH:BSP (red) and PvGST:GSH:BSP (blue).
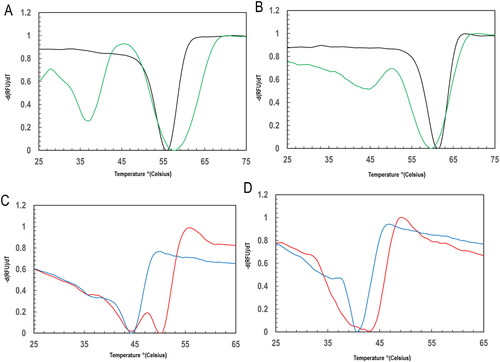
Table 1. Summary of the melt peaks showing the stability of PfGST and PvGST in the Presence of GSH and BSP.
Figure 5. Plots towards the determination of the steady-state kinetic parameters of PfGST and PvGST towards GSH in the presence and absence of BSP using Michaelis-Menten and Lineweaver-Burke models at varying GSH concentrations. (A). A Michaelis-Menten plot of 300 nM PfGST (black) and PvGST (green), (B). A Lineweaver-Burke straight line steady-state kinetics plot of PfGST (black) and PvGST (green), (C). Michaelis-Menten plot of 300 nM PfGST in the presence of 0.5 mM BSP (red) and PvGST in the presence of 0.5 mM BSP (blue), and (D). A Lineweaver-Burke straight line steady-state kinetics plot of PfGST in the presence of 0.5 mM BSP (red) and PvGST in the presence of 0.5 mM BSP (blue).
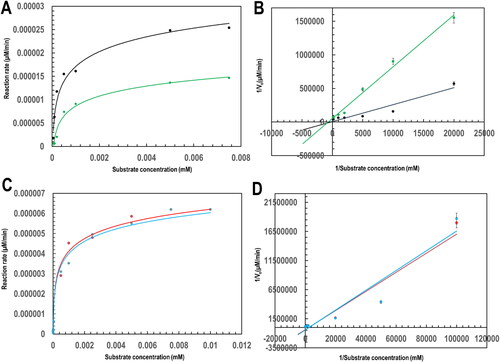
Table 2. Steady-state kinetic evaluation of PfGST and PvGST in the presence and absence of BSP.
Table 3. BSP’s predicted physicochemical descriptors, ADMET parameters, pharmacokinetic properties, and its’ drug-like nature.
Figure 6. Protein–ligand complex ribbon representation of the induced fit docking best pose for (A) PfGST:BSP complex, (B) PvGST:BSP, showing BSP binding at the dimer interphase of PfGST and PvGST. The image is a snapshot from the induced fit ligand docking algorithm implemented in Schrodinger Maestro v13.0.
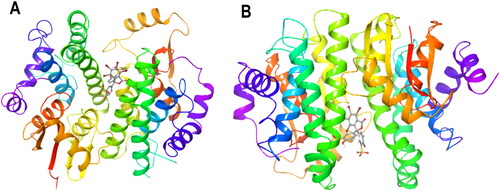
Figure 7. 2D ligand interaction plot highlighting the side chains involved in the binding between the interaction of (A) IFD docking pose of BSP with PfGST and (B) amino acid residue’s position of BSP with PfGST over 500 ns simulation. (C) IFD docking of BSP with PvGST and (D) amino acid residue’s position of BSP with PvGST over 500 ns simulation. Tyr108 is seen as the only non-polar amino side chains (green) involved in π–π* interaction with BSP’s phenyl moiety in both PfGST and PvGST, while similar amino residues’ involvement were seen during docking and the average simulation time. These Images were snapshots from the Maestro 2D interaction diagram implemented in Schrödinger Maestro 13.0.
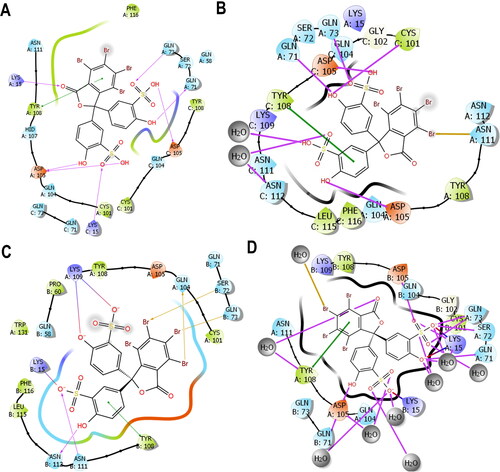
Figure 8. PfGST and PvGST’s structural alignment and sequence analysis reveal the similarity in positions of the amino acid residues taking part in the bonding and simulation interactions using Expresso™. Lys15, Gln 71, Gln 73, Ser72, Cys101, Asp105, Tyr108, and Asn111 were all conserved in both proteins.
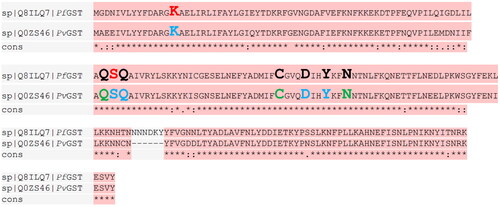
Table 4. Simulation quality analysis parameters and data of the four systems the 500 ns MD.
Figure 9. Simulation event analysis generated profile showing (A) the radius of gyration (Rg) of the apo systems of PfGST (black) and PvGST (green). (B) the radius of gyration (Rg) of the protein-ligand complex PfGST:BSP (red) and PvGST:BSP (blue) throughout the 500 ns simulation time plotted in picoseconds (ps).
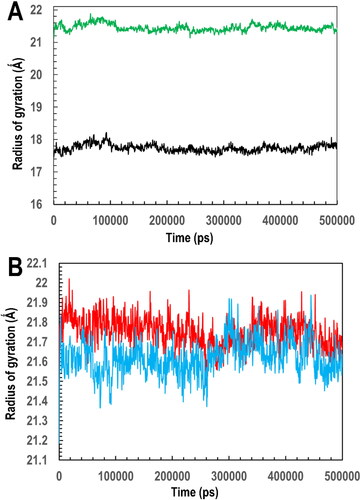
Figure 10. Analysis of the simulation trajectory showing (A) the RMSD of the Cα atoms and (B) the RMSF of the side chains as a function of the 500 ns simulation time for apo-PfGST (black), apo-PvGST (green), PfGST:BSP complex (red), PfGST:BSP complex (blue).
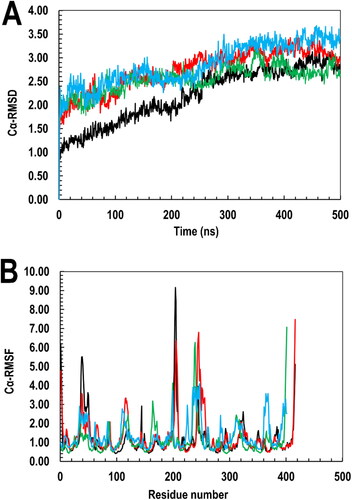
Figure 11. The interaction of BSP with PfGST and PvGST in respect of their (A) MolSA quantitatively revealing BSP’s interaction at both protein’s molecular environment, with PfGST:BSP’s trajectory (red) showing a higher MolSA than PvGST:BSP (blue) and (B) global SASA showing similar binding dynamics of BSP in the two proteins. The PfGST:BSP’s SASA (red) is however higher than that of PvGST:BSP (blue).
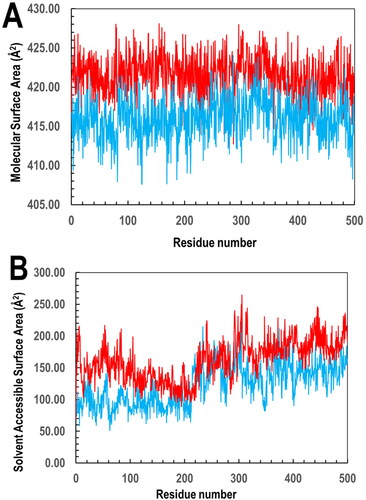
Figure 12. Amino acid side chains interactions and types of interactions stacked bar charts between (A) PfGST:BSP and (B) PvGST:BSP, throughout the 500 ns simulation. The interaction diagram showed H-bonds are categorized into backbone acceptor; backbone donor; side-chain acceptor; side-chain donor. Hydrophobic interactions are categorized into π–cation; π–π*; and other, non-specific interactions. The stacked bar charts are normalized throughout the 500 ns trajectory. The images were obtained with the use of the Ligand Interaction Algorithm implemented in Maestro v13.0.
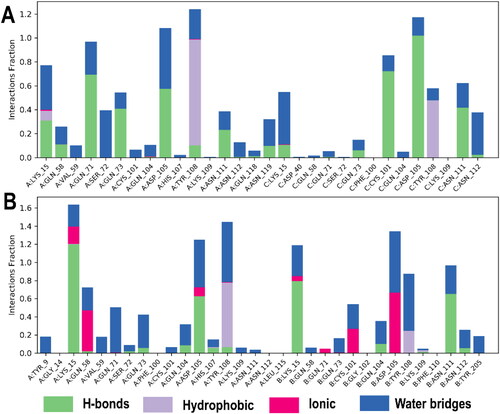
Table 5. MM/GBSA calculated binding energy of BSP interaction with PfGST and PvGST.
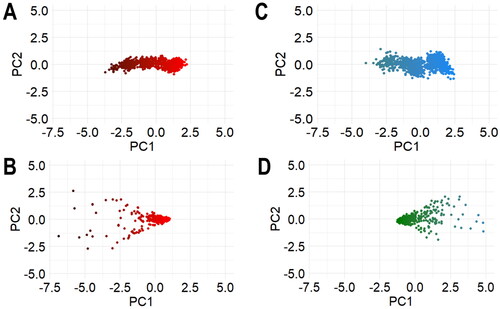
Figure 13. The subspace trajectories projections of the first two principal components (PC1 and PC2) in respect of their (A) Cα RMSD of PfGST and PfGST:BSP and (B) Cα PvGST and PvGST:BSP, (C) Cα RMSF of PfGST and PfGST:BSP and (D) Cα PvGST and PvGST:BSP.