
Figures & data
Figure 1. Identification of the optimal cluster number of TCGA-SKCM. (A) Optimal cluster number of SKCM identified by two parameters. Bule represents the cluster prediction index, and red represents the gap statistics. (B) Cluster number was identified as 2 with the application of ten multiomics integrative clustering algorithms. (C) The similarity of each sample was quantified by the silhouette score. (D) Overall survival analysis, progression-free survival analysis (E) and disease-specific survival analysis (F) between MOCS1 and MOCS2. (G) Heatmap illustrating the difference across five omics, and the top 10 different signatures of each profile between MOCS1 and MOCS2 are annotated on the left.
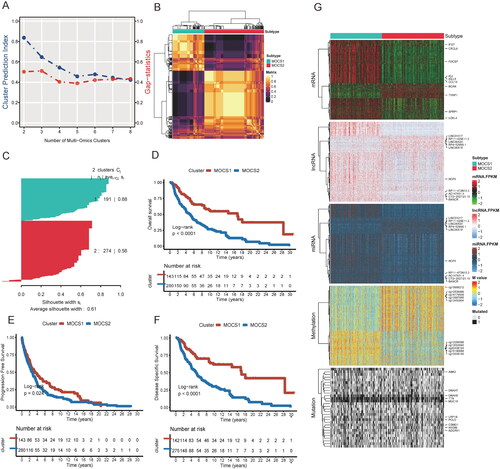
Figure 2. Biofunction differences based on DEGs between MOCS1 and MOCS2. (A) Gene ontology analysis including biological process, cellular component (B) and molecular function (C) based on DEGs extracted from MOCS1 and MOCS2. (D) Kyoto Encyclopedia of Genes and Genomes (KEGG) analysis based on GSEA from the Reactome and Msigdb (E) databases.
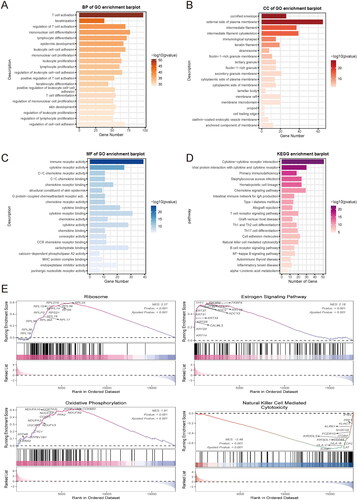
Figure 3. Differences in immune signatures, components, and tumor immunity steps between MOCS1 and MOCS2. (A) Heatmap illustrating the differences in immune marker expression and cellular components (B) between MOCS1 and MOCS2. (C) Boxplots indicate the difference in seven tumor immunity steps between subtypes.
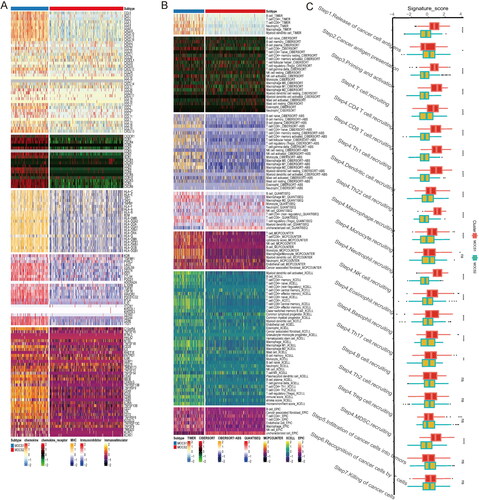
Figure 4. Landscape of immune score and therapy response between subtypes (A–D) Difference across RNAss immune, stromal and ESTIMATE scores, from left to right. (E) Distinctive landscape of immune check inhibitor expression, immune score, and tumor infiltration score based on methylation, from top to bottom. (F) Violin plot indicating differences in immune dysfunction scores. (G) Different response rates to immune checkpoint inhibitors based on the TIDE algorithm.
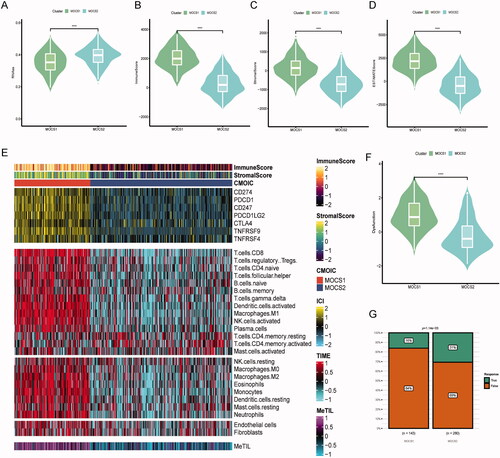
Figure 5. Association between multiomics-based subtypes and genomic variation. (A) OncoPrint was depicted by the most significant mutated genes between MOCS1 and MOCS2. (B) Forest plot indicating the prognostic impact of mutations between MOCS1 and MOCS2. (C) Onco-pathways and drug categories (D) related differences between subtypes. (E) Interaction effect of mutated genes between MOCS1 (left) and MOCS2 (right). (F) Copy number variation difference between MOCS1 and MOCS2, including copy number gain and loss.
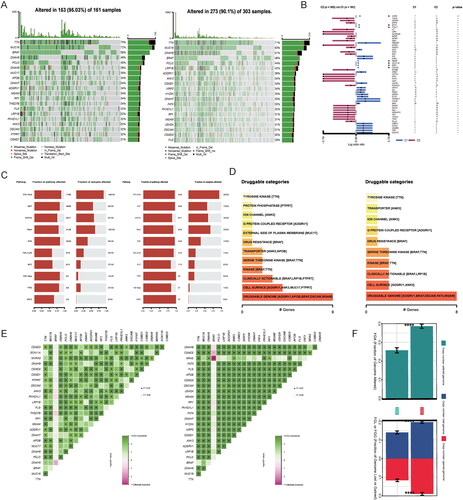
Figure 6. Difference in therapeutic sensitivity between MOCS1 and MOCS2 among different drug-related databases. (A) Box violin plots for the estimated IC50 of erlotinib, rapamycin and sunitinib between MOCS1 and MOCS2. (B) Potential agents efficacious for inferior subtype MOCS2. (C) Different IC50 values of clinical or preclinical agents sensitive to MOCS1 and (D) MOCS2.
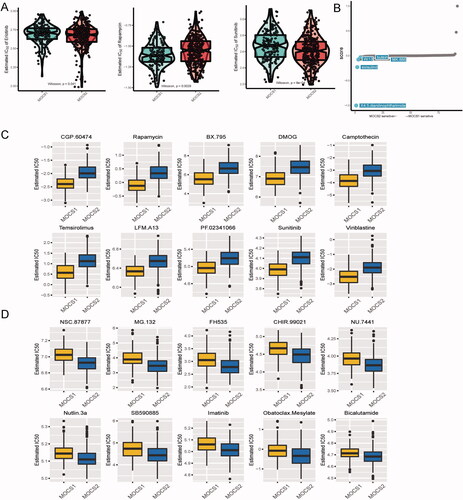
Figure 7. Testing the robustness of remodelling between MOCS1 and MOCS2. (A) Heatmap of NTP in GSE19234 (left) and GSE65904 (right) with the application of subtype-specific upregulated biomarkers retrieved from MOCS1 and MOCS2 in TCGA-KIRC. (B) Kaplan–Meier survival plot of the predicted OS of GSE19234 (left) and GSE65904 (right).
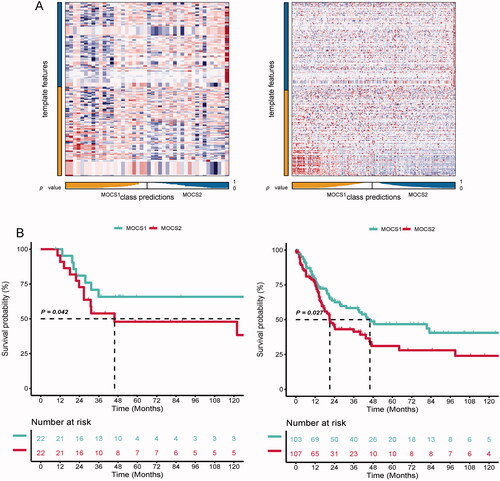
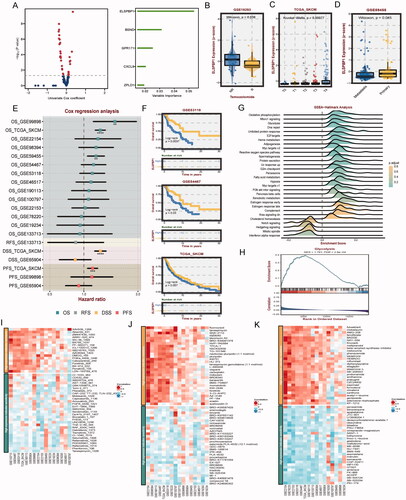
Figure 8. Clinical and biological roles of ELSPBP1 in SKCM. (A) Univariable cox value and corresponding pvalue of each example gene from MOCS1 and MOCS2 in volcano plot; prognostic importance of leading genes of SKCM in bar plot. (B) Expression level of ELSPBP1 between patient response and nont-response to temozolomide. (C) Different expression level of ELSPBP1 in different stage tumor tissues in SKCM. (D) Different expression level of ELSPBP1 in metastasis and primary tumor tissues in SKCM. (E) Cox analysis of prognostic value of ELSPBP1 across multi SKMC datasets. (F) KM curves indicate patient with high expression of ELSPBP1 owned poor prognosis in GSE53118, GSE64467 and TCGA-SKCM. (G) Hallmarks related to ELSPBP1 in TCGA-SKCM. (H) ELSPBP1 could stimulate glycolysis in TCGA-SKCM. (I) Correlation of IC50 and ELSPBP1 expression level in GDSC, (J) CTRP and (K) PRISM databases.
Supplemental Material
Download Zip (7.2 MB)Data availability statement
The original contributions presented in the study are summarized in the Methods and Materials section, and further questions can be addressed to the corresponding authors.