Figures & data
Table 1. List of drugs from the ZINC15 database with docking score and binding energy scores.
Table 2. Ligand interaction diagram of the selected ten drugs after XP docking.
Table 3. Predicted ADME properties of the selected drugs using the SwissADME tool.
Figure 1. RMSD plot of ligand-protein complexes. RMSD of (a) Panobinostat (b) Tasimelteon and (c) Melphalan and (d) Ketoprofen with the active site of HDAC1 protein.
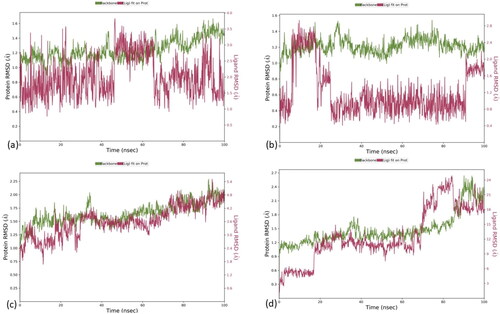
Figure 2. MMGBSA of drug ligand complexes.
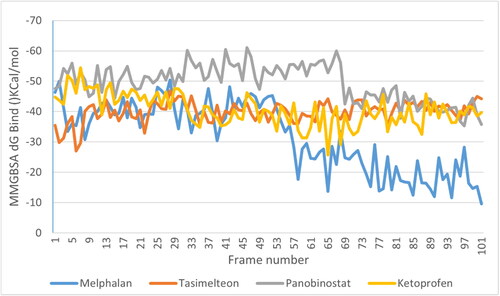
Figure 3. Ligand-Protein interaction diagram after MD of (a) Panobinostat (b) Tasimelteon and (c) Melphalan and (d) Ketoprofen with the HDAC1 protein.
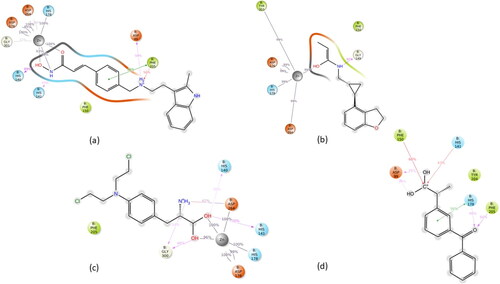
Figure 4. Ligand-protein contacts of (a) Panobinostat (b) Tasimelteon (c) Melphalan and (d) Ketoprofen throughout 100 ns time frame with HDAC1 protein.
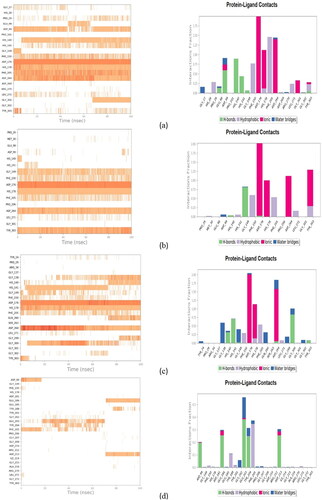
Figure 5. Concentration vs Percentage cell death graph of (a) Panobinostat (b) Melphalan (c) Tasimelteon (d) Temozolomide in U87 MG cells.
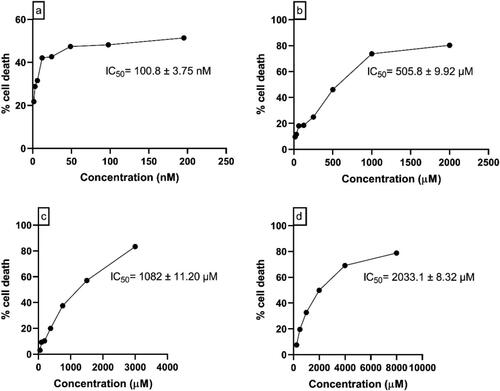
Figure 6. Concentration vs Percentage cell death graph of (a) Panobinostat (b) Melphalan (c) Tasimelteon (d) Temozolomide in C6 glial cells.
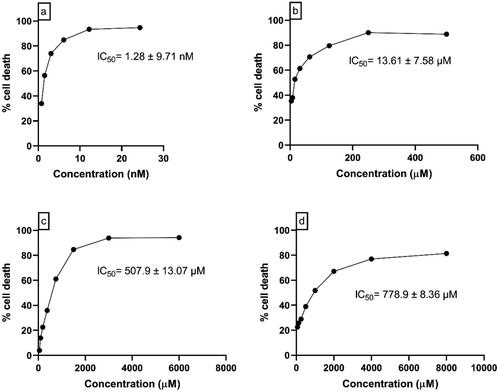
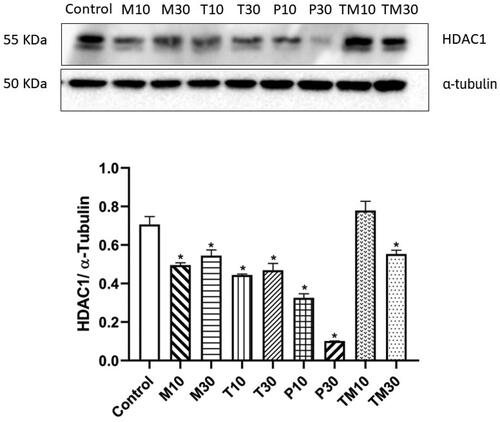
Figure 7. Representative image of western blot analysis of HDAC1 protein in U87 MG cells and relative density ratio of HDAC1/α-tubulin. The values are represented as mean ± SEM, where *p < 0.01 vs control group (n = 3). 10 and 30 represent the IC10 and IC30 doses of M–Melphalan, T–Tasimelteon, P–Panobinostat and TM–Temozolomide, respectively.
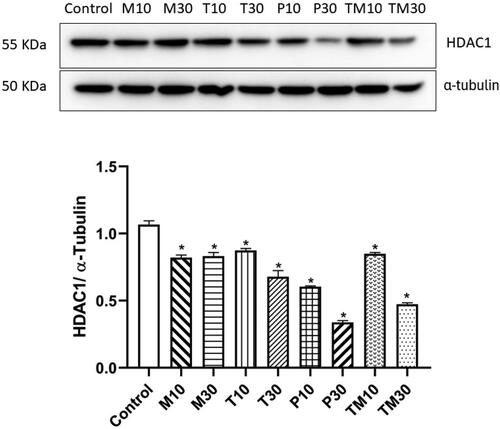
Figure 8. Representative image of western blot analysis of HDAC1 protein in C6 glial cells and relative density ratio of HDAC1/α-tubulin. The values are represented as mean ± SEM, where *p < 0.01 vs control group (n = 3). 10 and 30 represent the IC10 and IC30 doses of M- Melphalan, T- Tasimelteon, P- Panobinostat and TM- Temozolomide, respectively.