Figures & data
Fig. 1 Feasible and infeasible (π(6)+K 1 = 3+2 ≥ 6) forward position-shifting scenarios for n = 8 and K 1 = 2.
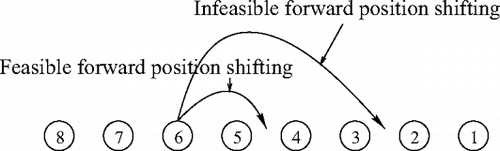
Fig. 2 Feasible and infeasible (π(2)−K 2 = 7−3 ≤ 2) backward position-shifting scenarios for n = 8 and K 2 = 3.
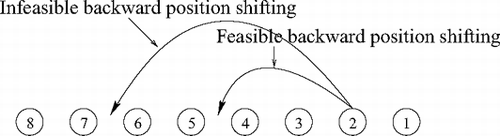
Fig. 3. Percentage difference between the optimal cost for a problem with limited flexibility, K 1 < n−1, and K 2 = n−1, and the one for a problem with full flexibility, K 1 = K 2 = n−1 (percentage difference is defined as γ = 100×(|z*(K 1 = k 1,K 2 = n−1)− z*(K 1 = n−1,K 2 = n−1)|/(z*(K 1 = 1,K 2 = n−1)−z*(K 1 = n−1,K 1 = n−1)))).
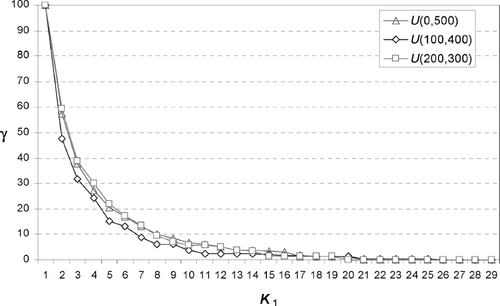
Fig. 4 Average percentage difference between the optimal costs of problems with (K 1 = K 2 = k) and problems with (K 1 = k±δ,K 2 = k∓δ) for δ ∈ {−4, …,0,…,4} and k = 1,…,10 for five problem instances with n = 30 and a cost matrix with U(100,400) (percentage difference defined as γ′ = 100×(|z*(k,k)−z*(k±δ,k∓δ)|/z*(k,k))).
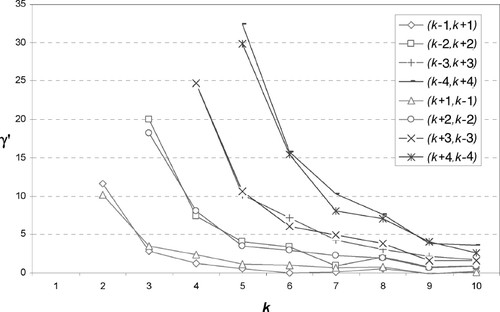
Fig. 5 Combined effect of K 1 and K 2 on the average optimal total cost for five problem instances with n = 30 and a cost matrix with U(100,400).
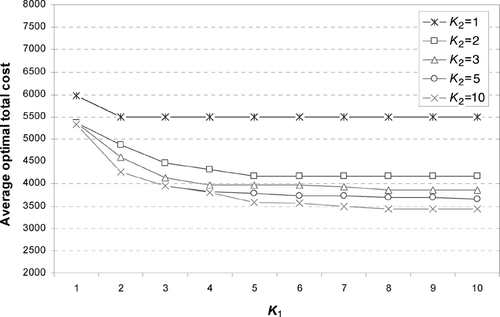
Fig. 6 Average percentage difference between the optimal cost and the heuristic solution cost for five problem instances with n = 30 and a cost matrix with U(200,300).
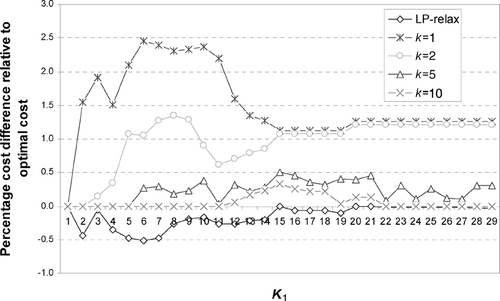
Fig. 7 Average percentage difference between the optimal cost and the heuristic solution cost for five problem instances with n = 30 for a cost matrix with U(100,400).
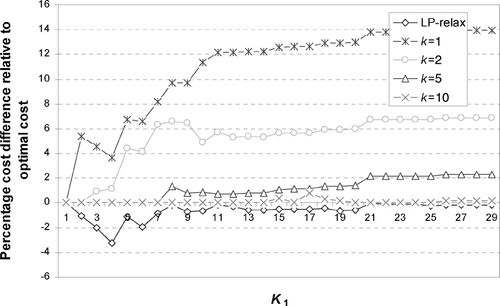
Fig. 8 Average percentage difference between the optimal cost and the heuristic solution cost for ten problem instances with n = 30 for a cost matrix with |i−j|× U(10,40).
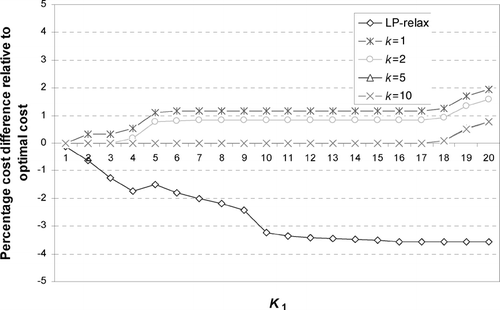
Fig. 9 Average percentage difference between optimal cost and heuristic solution cost for ten problem instances with n = 30 for a cost matrix with (30−|i−j|)× U(10,40).
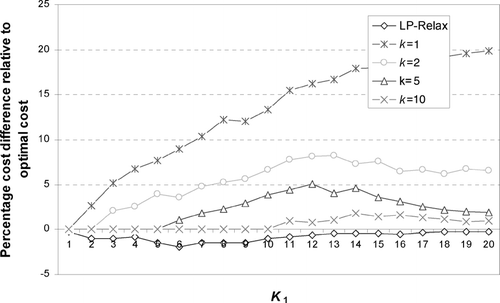
Table 1 Percentage difference ((Opt Sol.− LP-relax) × 100/LP-relax) between the optimal cost, the heuristic solution cost and the improvement heuristic solution cost (n = 30, K 1 = 4, K 2 = 29, U(100, 400)).
Fig. 10 Comparison of average CPU time for different values of k for five problem instances with n = 30 for a cost matrix with |i−j|× U(10,40).
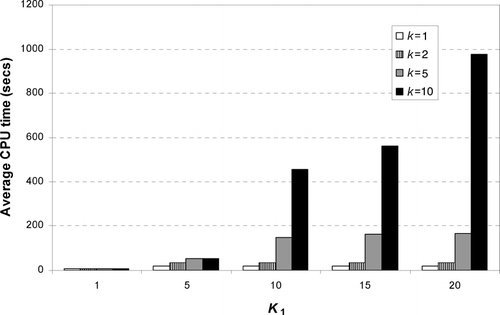
Table 2 Percentage difference ((Opt Sol.− LP-relax) × 100/LP-relax) between optimal solution and linear programming relaxation solution with and without the valid inequality (n = 30, U(0, 500))
Table 3 Cost per gallon for different paint colors
Fig. 11 Impact of resequencing flexibility on the total cost (average percentage for 13 production days).
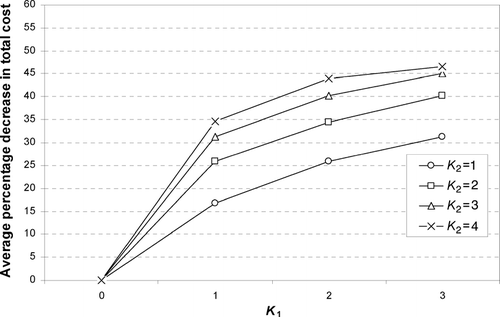
Table 4 Daily production requirements for a 13-day period sample
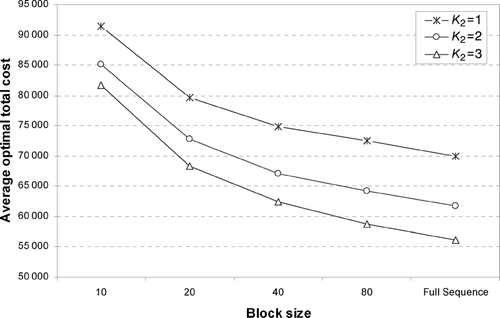
Fig. 12 Impact of the block size on the total cost for K 1 = 2 (average cost for 13 production days).