Figures & data
Figure 1. All convictions (a) and convictions by crime type (b) per 100,000 individuals in the general Swedish population aged 15 and over, 1975–2015.
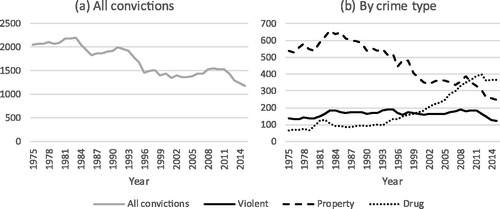
Figure 2. (a–i) An ideal-typical model with respect to how the development of the crime rate over successive birth cohorts may reflect similar or different trends between participation (dashed arrows) and frequency (solid arrows).
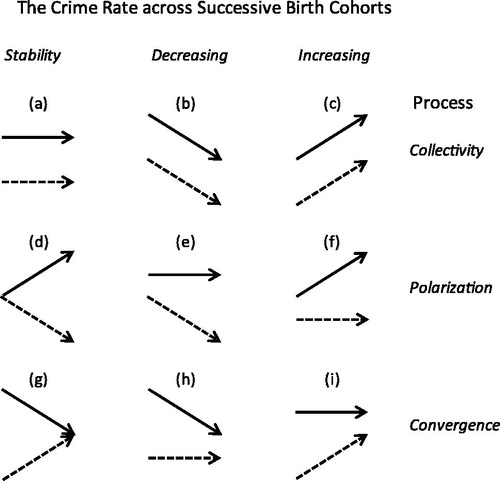
Figure 3. (a, b) Decomposition of the crime rate (a) into participation and frequency (b) by birth cohort. Males residing in Sweden at age 15 followed to age 30.
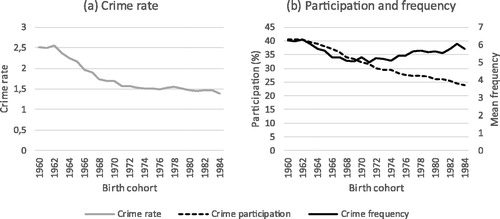
Figure 4. (a, b) Decomposition of the crime rate (a) into participation and frequency (b) by birth cohort. Females residing in Sweden at age 15 followed to age 30.
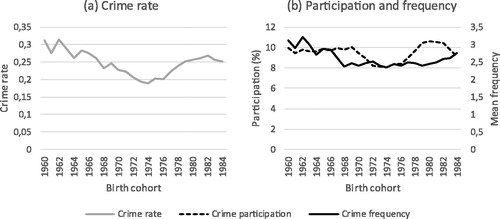
Table 1. Decomposition of the crime rate into participation and frequency by crime type and grouped birth cohort among males (a) and females (b).
Figure 5. (a, b) Age–crime participation curves (a) and age–crime frequency curves (b) by grouped birth cohort. Males only.
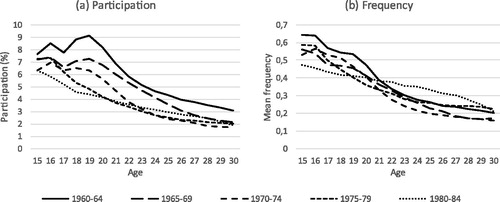
Figure 6. (a, b) Age–crime participation curves (a) and age–crime frequency curves (b) by grouped birth cohort. Females only.
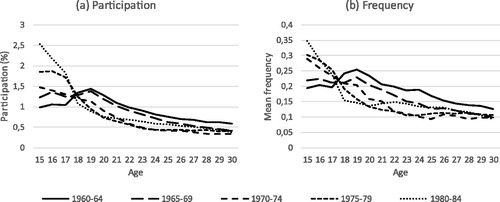
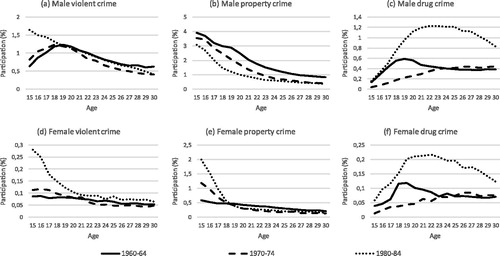
Figure 7. (a–f) Age–crime participation curves by crime type, grouped birth cohort, and gender.