
Figures & data
Table 1. Prior studies using random judge assignment to estimate effect of custodial versus noncustodial sanctions on recidivism.
Figure 1. First stage—The probability of imprisonment by judge. Notes: The horizontal dashed line is the sample mean imprisonment probability. The size of the circle is proportional to the number of cases sentenced by each judge.
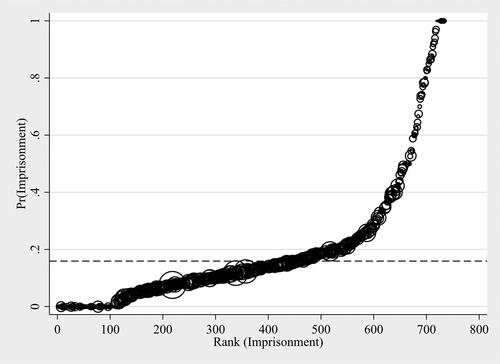
Table 2. Estimated effects of imprisonment versus noncustodial sanctions on recidivism prevalence by time since release and IV estimator.
Table 3. Estimated effects of imprisonment versus noncustodial sanctions on recidivism incidence by time since release and IV estimator.
Figure 2. Mean recidivism rate during 1 yr, 3 yr, and 5 yr follow-up period, by judge’s tendency to incarcerate. Notes: The horizontal dashed lines are sample mean recidivism probabilities, while the angled solid lines are linear fits. The size of the circle is proportional to the number of cases sentenced by each judge.
Figure 3. Pre- to posttreatment incidence of criminal behavior, 1 yr, 3 yr, and 5 yr.
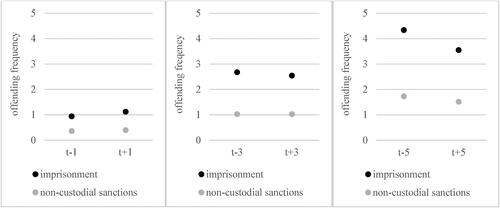
Table 4. Estimated effects of prison sentences up to one year versus noncustodial sanctions on recidivism prevalence and incidence by time since release and IV estimator.
Table 5. 2SLS estimates of effects of imprisonment versus noncustodial sanctions on recidivism prevalence and incidence.
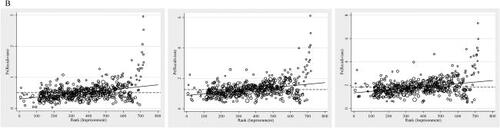
Table A1. Randomization checks—global F-tests
Table A2. Measurement properties for all variables
Table A3. Estimated effects of imprisonment versus noncustodial sanctions on recidivism prevalence and incidence without covariates (other than fixed effects).
Table A4. Estimated effects of imprisonment versus noncustodial sanctions on recidivism prevalence and incidence using different caseload thresholds
Data Availability Statement
Restrictions apply to the access of the data that support the findings of this study as these data can only be reused if permission has been granted by all relevant authorities, i.e. Statistics Netherlands (CBS), Public Prosecutor’s Office, and the Research and Documentation Centre of the Netherlands Ministry of Justice and Security (WODC). The CBS and WODC only grant data access to institutions, services and organizations that are located in countries that fall under the scope of the GDPR (the European Economic Area) or to which an adequacy decision of the European Commission applies.